
Published
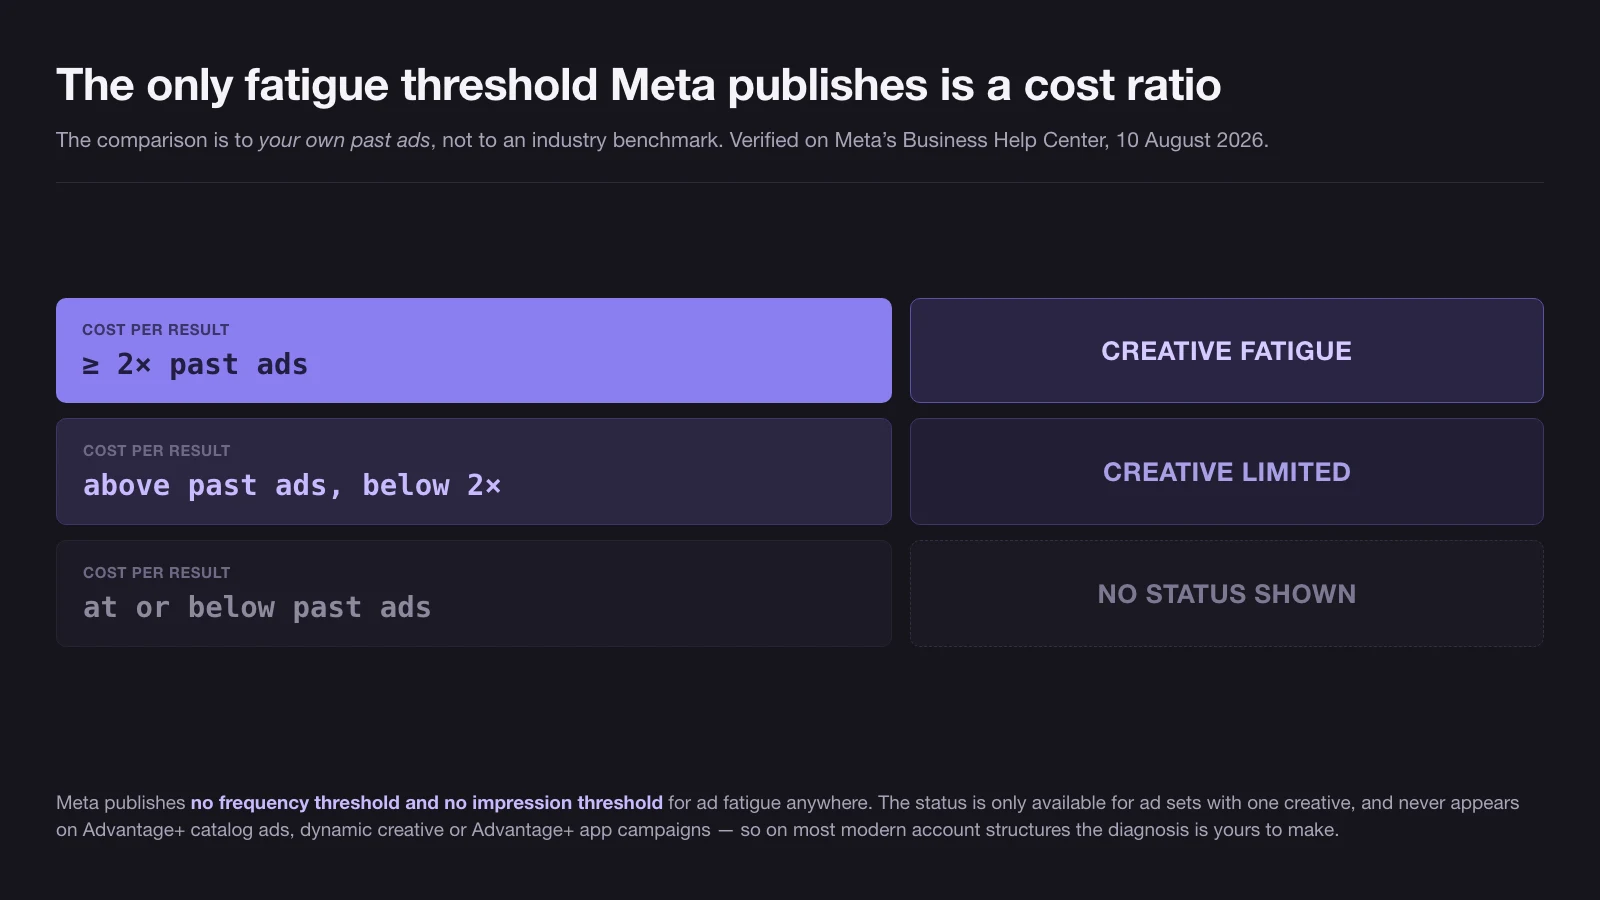
Ad fatigue is the decline in response that follows repeated exposure to the same creative. Meta is the only major platform that publishes a threshold for it, and that threshold is a cost ratio rather than a frequency number: a cost per result above your past ads flags Creative limited, and one at or above twice your past ads flags Creative fatigue.
How this was checked. For this query in the United States on 10 August 2026, Google returned an AI Overview, a People Also Ask block, a perspectives carousel and a video result, leaving seven organic links. Every one of them defines the term and recommends refreshing creatives. Not one states the threshold Meta publishes in its own help centre, not one gives the arithmetic that decides how long a creative lasts, and several repeat frequency benchmarks that have no traceable source. Every number below carries the document that states it and the year of the data behind it. Where nothing is published, this page says so instead of filling the gap.
Ad fatigue is a response decline caused by repeated exposure to the same creative. Three neighbouring problems get filed under the same name and need different fixes:
- Not audience saturation. Saturation is running out of people to reach. It raises frequency mechanically even when the creative is still working, and it is solved by audience size, not by new artwork.
- Not banner blindness. Blindness is a learned habit of ignoring an ad-shaped region of a page regardless of what is in it. It affects the placement, not the creative.
- Not a weak creative. An ad that never worked is not fatigued. Fatigue is a decline from a level the ad once held, which means it can only be diagnosed against that ad’s own history.
The only ad fatigue threshold Meta publishes is a cost ratio
Meta’s Creative Fatigue Recommendations page in the Business Help Center is the single place any major platform commits to a number, and the number is not a frequency. Meta says it considers all recent exposures of the ad’s image or video, including exposures from other campaigns run from the same Page, together with the ad’s cost per result. Then, verbatim: when cost per result is more than ads you ran in the past but less than twice as much, you see a Creative limited status; when it is more than or equal to twice as much, you see a Creative fatigue status.
Three things follow that almost nobody repeats.
The comparison is to your own history, not to a benchmark. There is no industry number to fail against. The same cost per result can be healthy in one account and a fatigue flag in another, because the reference point is that advertiser’s own past ads.
The signal is priced, not behavioural. Falling click-through rate does not trigger the status. Cost per result does. That is a deliberate choice: it collapses every upstream cause into the one measure that matters to the buyer.
The feature barely applies to modern campaign structures. Meta states it is only available for ad sets with one creative, excluding Advantage+ catalog ads, dynamic creative and Advantage+ app campaigns, and that it is unavailable on the sales objective before an ad set is active. If you run dynamic creative, which most accounts do, this status will never appear. That does not mean fatigue is absent. It means the platform has stopped telling you about it, and the diagnosis moves to you.
Meta’s recommended response is also worth quoting because it contradicts standard practice: create another ad with a new image or video that is materially different from the original, and note that keeping your original ad active instead of pausing or turning it off may maximise results. The reflex to pause the tired ad is not what the platform advises.
Frequency is division, not a diagnosis
Meta defines frequency as the average number of times each account saw your ad and gives the formula plainly: impressions divided by reach. Reach, in the same help centre, is described as an estimate calculated using sampled data. Impressions count every time the ad is on screen, so the same person seeing it twice in a day is two impressions.
That makes frequency an output of three inputs, none of which is creative quality: how much you spent, what the auction charged, and how many people were available to reach. Hold the audience fixed and keep spending, and frequency must rise. It has no choice. Reporting a frequency of 3.4 as evidence of fatigue is reporting that you spent money into a finite audience.
The only guidance Meta attaches to the metric is directional: frequency may average 1 to 2 per ad set or may be much higher, and if performance begins to drop as frequency rises, the audience may be experiencing fatigue. That is a conditional statement about a joint movement, and the condition is the important half. Frequency rising while cost per result holds steady is not a problem to solve.
First time impression ratio is the saturation number, and Meta never scores it
Buried in Meta’s metric glossary is the number that actually separates saturation from fatigue. First time impression ratio is defined as the percentage of your daily impressions that comes from people seeing your ad set for the first time, calculated as accounts reached for the first time divided by impressions.
Read it next to cost per result and the two-by-two writes itself:
| First time impression ratio | Cost per result | What it points to |
|---|---|---|
| Holding steady | Rising | Creative decline or auction inflation — fresh people are still arriving, so check CPM before blaming the creative |
| Falling | Rising | Audience exhaustion — you are re-serving the same people |
| Falling | Steady | Normal maturation of a campaign that still works |
| Holding steady | Steady | Nothing to fix |
Meta’s own guidance points at exactly one of those cells: if first time impression ratio is dropping significantly along with performance, it may be time to broaden the audience or find a new one. Note what that prescribes — a targeting change, not a creative one. Meta publishes no threshold value for this metric either. There is no number at which the ratio is too low. You are comparing it to its own trend.
Where the frequency thresholds you have read come from
Search this topic and you will meet the same numbers repeatedly: fatigue begins above a frequency of 2.5, or 3 for prospecting and 5 for retargeting; engagement falls 20 to 30 per cent week over week; click-through rate drops 40 per cent over a campaign’s life; the inflection arrives between days three and seven.
None of them has a primary source. Tracing the citations leads to other blog posts, then to stat-aggregator pages, then to nothing. Several are attributed to “Meta’s own data” while Meta’s documentation publishes no frequency threshold anywhere — which is checkable in about a minute, and evidently rarely is. The tiered frameworks that pair them, complete with percentage bands, state neither a sample size nor a year of data.
This matters beyond pedantry. A borrowed threshold produces a real decision: an ad gets paused, a budget gets moved, a creative team gets briefed. The floor under that decision is a number somebody wrote in a blog post. If you use a threshold, use one you measured in your own account across at least a full purchase cycle, and write down the window you measured it over.
What happened when large datasets went looking for wear-out
The largest bodies of evidence on advertising wear-out point the opposite way from the practitioner consensus, and the gap is not small.
- Analytic Partners’ ROI Genome, reported by Mark Ritson in Marketing Week from the 2022 ROI Genome report and covering ads examined in 2020, looked across 51,232 campaigns and found wear-out in 14 of them at the point the creative was replaced. The other 51,218 were pulled while showing no signs of it.
- ABX and the Radio Advertising Bureau, presented in 2024 and written up in March 2025, analysed 25,000 radio creative tests and found statistically significant erosion in two. Forty-three creatives in that set had run for more than two years with over two million dollars of cumulative spend; of the twelve of those ABX had retested, ten showed no erosion at all, and the two that did sat at the top of the spend and duration range — the $8M-and-above level ABX flags as the point where effectiveness might start to wane.
- System1, in a 2023 analysis of ads tested between 2020 and 2022, put the mean Star Rating of ads in their first month at 2.2 out of 5 and the mean for ads running continuously for two or more years at 2.2 out of 5.
- Kantar’s creative tracking reports no evident impact of how long an ad has been running.
Read those honestly and their limits are as important as their headline. Every one of them measures brand advertising on broadcast and multi-channel plans, where a viewer meets a spot a handful of times over months. None measures paid social delivery, where a retargeting pool of six thousand people can absorb four impressions each inside a week. The conclusion these datasets support is narrower than “fatigue is a myth” and more useful: creative wear-out is rare on brand campaigns with large audiences and slow frequency accumulation, and the fast decay familiar to performance buyers is mostly a delivery phenomenon driven by audience size, not an audience getting bored of the artwork.
The one large paid-social dataset in public circulation confirms the shape of the problem without touching fatigue directly. Motion’s Creative Benchmarks 2026, covering more than 550,000 ads from over 6,000 advertisers on Meta and Instagram across roughly 1.3 billion dollars of spend from September 2025 to early January 2026, found that around 5 per cent of ads take at least ten times the account median in spend while about half receive little or none. Creative volume is not the same thing as creative rotation, and a library of near-identical variants does not buy you a longer runway.
Ten exposures, not three: what the repetition research actually measured
The most-cited claim in this field is that three exposures are enough. It comes from Herbert Krugman’s 1972 essay in the Journal of Advertising Research, and it does not say that. Krugman described three psychological stages of response — a first exposure that asks “what is it?”, a second that asks “what of it?”, and a third that works as a reminder and begins disengagement — and stated explicitly that there is no such thing as a fourth exposure psychologically. He was describing a mental sequence, not a media schedule, and the essay was theoretical rather than empirical.
The peer-reviewed answer arrived much later. Schmidt and Eisend’s 2015 meta-analysis in the Journal of Advertising, pooling 37 studies and 312 effect sizes — 19 of them on attitude toward the brand, 18 on recall — found that attitude toward the brand follows an inverted U that peaks at around ten exposures, and that recall rises close to linearly and does not level off before the eighth. Attitude toward the ad is a separate construct the paper did not pool, and the distinction matters: the curve describes what repetition does to feelings about the brand, not to feelings about the execution. The paper positions itself explicitly against the minimalist reading of Krugman.
Two older studies fill in the mechanism and the schedule. Cacioppo and Petty (1979), in the Journal of Personality and Social Psychology, ran participants at zero, one, three and five exposures and found agreement rising then falling — the inverted U, driven by counterarguing that first falls and then climbs. Zielske (1959), in the Journal of Marketing, mailed thirteen print ads either weekly or once every four weeks; weekly delivery produced a higher peak in recall and a faster collapse, while the spaced schedule produced higher average awareness across the year. Spacing, not volume, was the lever.
One frequently quoted number deserves a warning label. The claim that more than three mobile advertisements a day makes people ignore the message traces to Rau, Zhou, Chen and Lu (2014) in Telematics and Informatics, a field study of pushed mobile advertising messages whose data predates 2014. The finding is real and the journal is peer-reviewed — and the paper sits behind a paywall, so the methodological detail repeated around it online is not verifiable from any open source. What can be said is that it measured pushed messages on phones, not feed-based social, display or programmatic inventory, and it should not be carried across.
Held together, the research says something uncomfortable for the standard advice: the exposure counts at which attitude actually turns down are far higher than the frequency figures performance buyers panic at, and the schedule matters more than the count.
How long one creative lasts, as arithmetic you can run before launch
You do not need a benchmark for creative lifespan, because it is determined before the campaign starts by three numbers you already have.
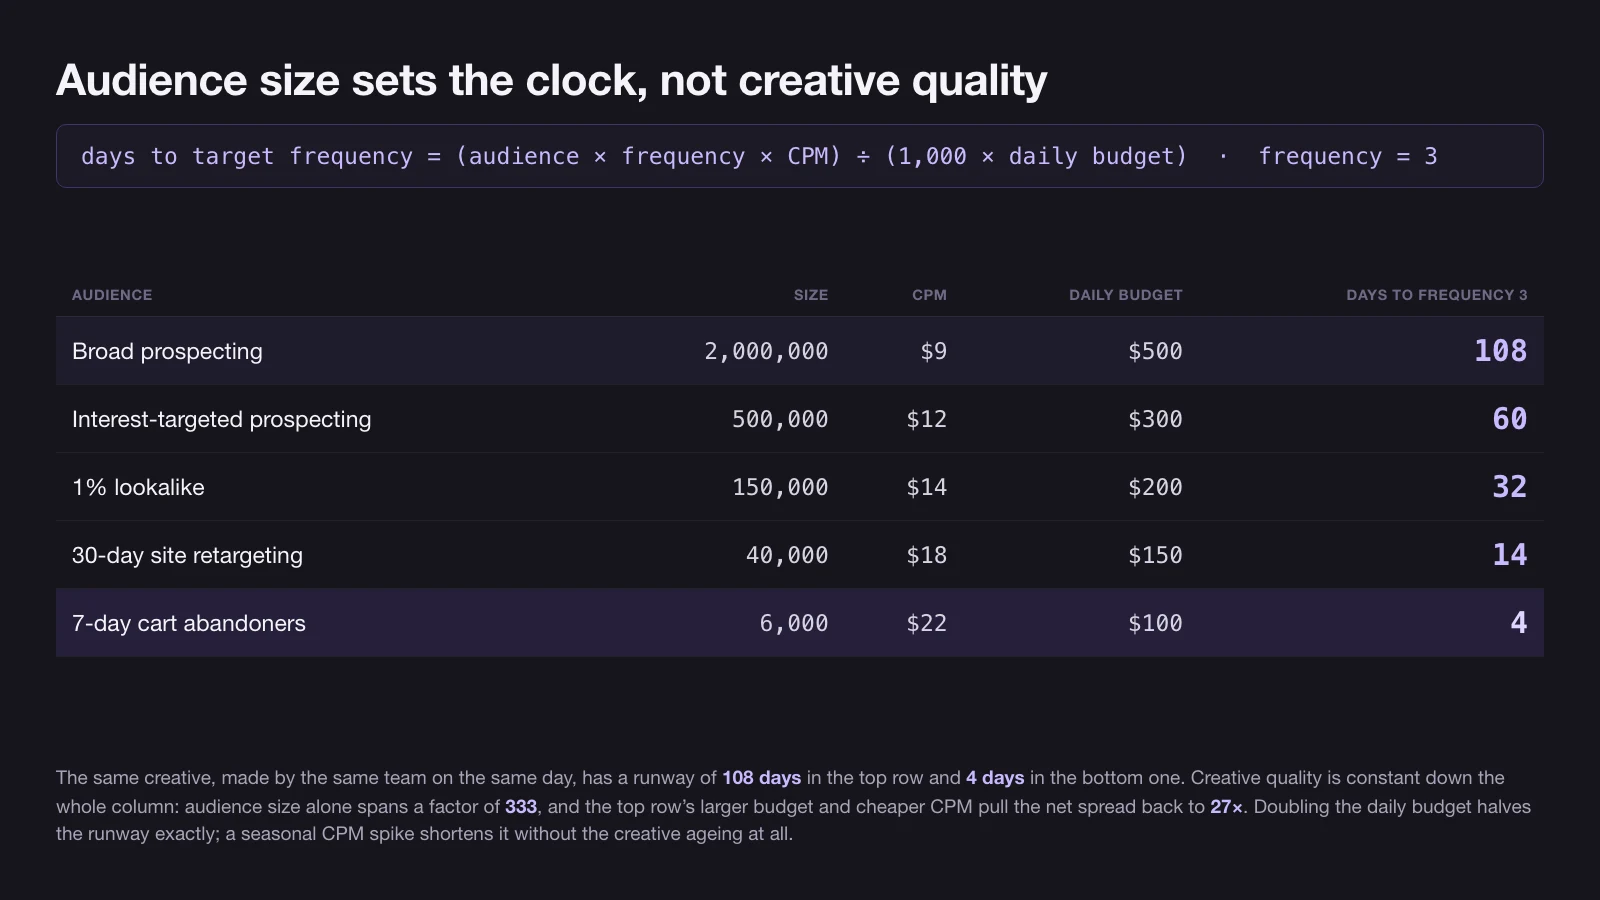
Days to reach a target frequency = (audience size × target frequency × CPM) ÷ (1,000 × daily budget)
The derivation is one line: a daily budget divided by CPM and multiplied by a thousand gives daily impressions; audience size multiplied by target frequency gives the impressions required; divide the second by the first. Nothing in it is proprietary or contested, and the cost side of the equation behaves the same way it does on Google Ads — CPM is an auction price you observe, not a constant you control.
Run it across a normal account structure at a target frequency of 3, and the spread is the whole story:
| Audience | Size | CPM | Daily budget | Days to frequency 3 |
|---|---|---|---|---|
| Broad prospecting | 2,000,000 | $9 | $500 | 108 |
| Interest-targeted prospecting | 500,000 | $12 | $300 | 60 |
| 1% lookalike | 150,000 | $14 | $200 | 32 |
| 30-day site retargeting | 40,000 | $18 | $150 | 14 |
| 7-day cart abandoners | 6,000 | $22 | $100 | 4 |
The same creative, made by the same team on the same day, has a runway of 108 days in the first row and 4 days in the last. Audience size sets the clock. On its own it is the largest term by far: the gap between two million people and six thousand is a factor of 333, and the broad row’s larger budget and cheaper CPM are what pull the net spread back down to twenty-seven. Creative quality is constant all the way down that column and explains none of it. This is why “refresh your creatives every two weeks” is useless as general advice: it is roughly right for one row of that table and badly wrong for the other four.
Two properties of the formula are worth internalising. Doubling the daily budget halves the runway exactly. And because CPM sits in the numerator, a seasonal auction spike shortens the runway on its own — your creative did not age faster in Q4, your impressions got more expensive.
The order the metrics move in, and how to falsify it on your own account
Practitioners describe a sequence: frequency rises, then CPM, then click-through rate falls, then conversion rate. No published dataset establishes that ordering. The closest academic work is a 2025 preprint proposing a path-signature method for detecting creative fatigue, validated on synthetic data and modelling click-through rate alone, which explicitly establishes no cross-metric sequence. Treat the ordering as a working hypothesis with a strong arithmetic backbone in its first step and folklore in its last.
What each movement can actually carry:
| Signal | What it proves on its own | What it does not prove |
|---|---|---|
| Frequency rising | That spend continued into a finite audience — this is division, not evidence | Nothing about the creative |
| CPM rising | That the auction got more expensive | Whether that is your relevance, a competitor’s budget, or the season |
| Click-through rate falling | That the same people responded less to the same creative — the first genuinely behavioural signal | Whether a different creative would do better |
| Conversion rate falling | That something after the click changed | That fatigue caused it |
The last row is where most diagnoses go wrong. As a working rule, fatigue is best modelled as a pre-click phenomenon that lives in the impression — though note that Meta scores it on cost per result, which is post-click, and nobody publishes evidence settling the question. Treat it as reasoning rather than a finding. A conversion rate that falls while click-through rate holds steady is pointing at the landing page, the offer, stock availability, or conversion tracking that has quietly broken — not at a tired image. Rotating creative in response to it changes the one thing that was still working.
The falsification test. Duplicate the ad set with identical targeting, budget and placements, and run a materially different creative against the incumbent over the same window. Compare cost per result at comparable frequency. If the new creative does not beat the old one, the creative was not the problem, and you have learned that for the price of one test rather than one rebuild. Meta’s own note that keeping the original active may maximise results is what makes this affordable to run.
Rotation cadence each platform actually publishes
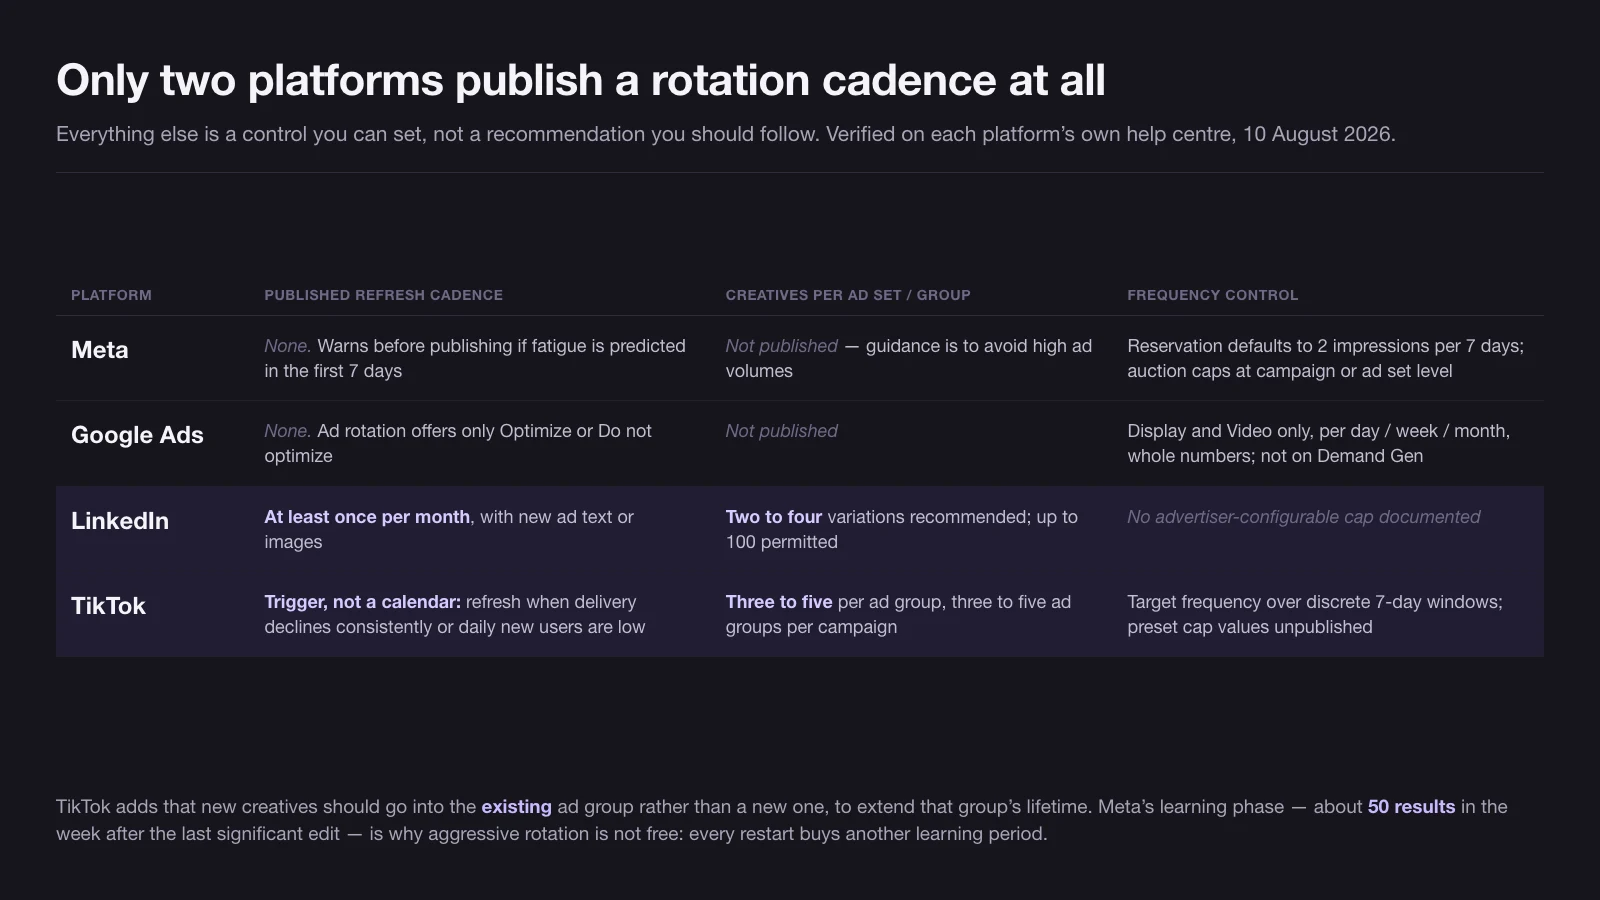
Only two of the major platforms publish a cadence at all, and one of them publishes it as a trigger rather than a calendar. Everything else in the table below is a control you can set, not a recommendation you should follow.
| Platform | Published cadence | Creatives per ad set or group | Frequency control |
|---|---|---|---|
| Meta | None. Warns before publishing if fatigue is predicted in the first 7 days | Not published; guidance is to avoid high ad volumes because the delivery system learns less about each ad | Reservation buying defaults to 2 impressions per 7 days; auction caps sit at campaign level with Advantage+ budget, or ad set level without it |
| Google Ads | None for creative refresh; ad rotation offers only Optimize or Do not optimize | Not published | Frequency capping on Display and Video only, per day, week or month, whole numbers; not supported on Demand Gen; Display counts viewable impressions only |
| Refresh ads at least once per month with new text or images | Two to four variations recommended; up to 100 permitted; four or five suggested for testing | No advertiser-configurable cap documented | |
| TikTok | Refresh when delivery results show a consistently declining trend or daily new users are low — explicitly a trigger, not a schedule | Three to five creatives per ad group, three to five ad groups per campaign | Target frequency measured over discrete 7-day windows; cap available on selected buying types, preset values unpublished |
Two details in that table are load-bearing. TikTok’s guidance adds that new creatives should be added to an existing ad group rather than spun into a new one, in order to extend the group’s lifetime — the opposite of the common habit of launching a fresh ad set per creative test. And Meta’s learning phase, which it describes as ending after about 50 results in the week following the last significant edit, is the reason aggressive rotation is not free: every restart buys another learning period, and on a small retargeting pool the campaign can spend most of its life inside one.
Google’s published target frequency ranges for YouTube reach campaigns — 2 to 7 weekly or 4 to 12 monthly for multi-format, and 2 to 4 weekly or 4 to 8 monthly for in-stream and bumper formats — are the closest thing to a per-format frequency table anyone publishes. They are buying targets for brand recall, not fatigue ceilings, and reading them as limits inverts their purpose.
What to change first when cost per result doubles
Ordered by cost of the action, not by how satisfying it feels:
- Check whether reach is still growing. If first time impression ratio has collapsed, this is saturation and no creative will fix it. Widen the audience or accept the ceiling.
- Check CPM against the account’s own last 90 days. An auction-wide price rise looks identical to fatigue in a cost-per-result chart and has nothing to do with your ad.
- Confirm the decline is pre-click. Click-through rate steady with conversion rate falling is not fatigue. Check the landing page, the offer and the event pipeline before touching the creative.
- Add a materially different creative without pausing the incumbent. Different concept, different opening frame, different claim — not a recolour. If you are changing formats as well as concept, the placement specifications that govern each surface decide whether the new asset is genuinely different or the same asset cropped.
- Only then consider consolidating or restructuring. Every significant edit restarts the learning period, which on a small audience can cost more than the fatigue did.
The pattern underneath all five steps is the same: fatigue is diagnosed against an ad’s own history, on cost, with reach growth as the tiebreaker. Benchmarks borrowed from elsewhere cannot do that job, because the only account whose baseline matters is yours. Structuring that measurement properly is most of what a competent Facebook ads programme does before it ever briefs a new asset.
11 / Reader questions
Frequently asked questions
01What causes ad fatigue?
Ad fatigue is caused by a finite audience meeting a continuing budget. Once the addressable audience has been reached, every additional dollar buys a repeat impression rather than a new one, so average frequency rises by arithmetic alone. Creative sameness makes people disengage faster, but the exhaustion of fresh reach is the mechanism underneath it.
02How long until ad fatigue sets in?
There is no published number of days, and any article that gives you one has invented it. The clock is set by your own media plan: divide audience size multiplied by your target frequency and CPM by a thousand times your daily budget. A 6,000-person cart-abandoner audience can reach frequency 3 in four days; a two-million-person prospecting audience can take over a hundred.
03What is a good ad frequency before fatigue?
No major platform publishes one. Meta states only that frequency may average 1 to 2 per ad set or may be much higher, and that rising frequency alongside falling performance is worth investigating. Google publishes target frequency ranges for YouTube reach campaigns — 2 to 7 weekly for multi-format, 2 to 4 for in-stream and bumper — but those are buying targets for brand recall, not fatigue limits.
04How do you measure ad fatigue?
Measure cost per result against the same creative's own earlier performance, not against a benchmark. Meta does exactly this: a cost per result above your past ads produces a Creative limited status, and one at or above twice your past ads produces a Creative fatigue status. Frequency and first time impression ratio are supporting evidence, not the verdict.
05How do you fix ad fatigue?
Add a materially different creative rather than pausing the old one. Meta's own guidance is explicit that keeping the original ad active instead of turning it off may maximise results. After that the order is audience expansion, then offer or landing page, then budget pacing. Changing the thumbnail colour is not a materially different creative.
06What are examples of ad fatigue?
A retargeting ad set whose cost per purchase doubles against its own earlier level while first time impression ratio falls toward zero is the textbook case, and it is the one Meta itself flags as Creative fatigue. So is a prospecting campaign whose click-through rate halves while reach flatlines. A campaign whose conversion rate falls while click-through rate holds steady is usually not fatigue at all.
07Does ad fatigue happen on Google Search?
Far less, because search ads are pulled by intent rather than pushed into a feed, and the same person rarely sees the same search ad many times in a week. Google does not offer frequency capping on Search campaigns at all. Fatigue is a feed and display problem, which is why every platform threshold discussed here comes from social and video inventory.