
Published
A go-to-market strategy for a startup is the decision about which channels get money, how much each gets, and what evidence stops or scales them. In the first 90 days that decision is arithmetic before it is judgement: a channel needs somewhere between a dozen and several hundred conversions before its cost per acquisition can be told apart from your ceiling — 50 to 250 covers the range that matters in practice — and most seed-stage budgets can buy that once.
How this was checked. For this query in the United States on 10 August 2026, Google returned an AI Overview, a video pack and an organic top ten led by Stripe, Antler, Arise GTM, Harvard Business School Online, Medium, Lean Labs and Zendesk. Between them they cover ideal customer profile, positioning, pricing, sales motion and launch sequencing, and several offer a downloadable template. Not one of them states a minimum spend per channel, a minimum conversion count, or a numeric rule for stopping. The confidence intervals and thresholds below were computed for this article; the method is given where they appear. Every external benchmark is attributed with its sample size, and the ones without a disclosed sample are named as such in the last section.
Why the first 90 days is a budget problem before it is a strategy problem
Every framework on the first page of Google gives you the same list of parts: define the segment, sharpen the positioning, set the price, pick the route to market, launch, iterate. The list is not wrong. It is just not the thing that decides how the quarter ends.
What decides it is that a startup running four channels on a seed budget will finish the quarter with four numbers and no findings. Each channel will have produced a cost per lead. Each of those costs will carry an uncertainty band wide enough to contain both a channel worth doubling and a channel worth closing. The team will then pick a winner from noise, put the next quarter’s money behind it, and discover in month six that it chose the wrong one.
The size of the budget is the reason. SaaS Capital’s 2026 spending survey — more than 1,000 private B2B SaaS companies, fielded in March 2026, self-reported — puts median marketing spend at 8% of ARR, with sales counted separately at 15%. Eight per cent of a million dollars of ARR is about $6,700 a month, or roughly $20,000 a quarter. That is the real order of magnitude most founders are allocating, and it is a great deal smaller than the number implied by an article that tells you to build a presence across paid search, paid social, content, outbound and events.
It also lines up with how these companies die. CB Insights’ March 2026 post-mortem study of 431 venture-backed shutdowns since 2023 — 385 with identifiable causes, coded with multiple reasons each — finds 70% ran out of capital, with poor product-market fit at 43%, bad timing at 29% and unsustainable unit economics at 19%. Running out of capital is where the story ends; spending a quarter’s budget on tests that could not have returned an answer is one of the ways companies get there faster.
Setting the cost ceiling before any channel is allowed to spend
A channel test is a comparison. Without a number on the other side of it, a cost per lead is just a cost.
The ceiling comes down from how quickly you need the money back. High Alpha’s 2025 SaaS Benchmarks report — 800+ operators, self-reported, roughly half the sample under $5M ARR — puts median CAC payback at 5 months for companies under $1M ARR, with an interquartile range of 2 to 8 months, rising to 8 months at $1–5M ARR and 14 months at $5–20M. The counterintuitive direction, where payback gets worse as companies grow, is what you would expect if early customers arrive through founder-led channels that cost labour rather than media.
Take the under-$1M band and work it through. A product at $400 a month with an 80% gross margin contributes $320 a month. A five-month payback target puts the CAC ceiling at $1,600.
Now the problem appears. At $20,000 a quarter and a $1,600 ceiling, a channel priced exactly at your ceiling delivers 12.5 customers in 90 days. Twelve conversions is not a measurement of a channel sitting anywhere near your ceiling — as the next section shows, a count that small carries an interval running from roughly half your observed cost to double it, and only a channel at half your ceiling clears a band that wide.
So the measured event has to move upstream, to whatever your funnel produces in the hundreds rather than the tens. If 5% of qualified leads become customers, the $1,600 customer ceiling becomes an $80 cost-per-lead ceiling, and $20,000 buys 250 leads at that price. That upstream move is the standard compromise, and it carries a standard cost: you are now optimising a proxy, so the definition of the proxy has to be tight. A lead that is a form fill from anyone is not the same object as a lead with a verified problem and a budget, and the difference between a marketing qualified and a sales qualified lead is exactly the thing that makes a cheap channel look good and a good channel look expensive.
How many conversions a channel needs before its cost per acquisition means anything
Conversions arrive as counts. A count carries its own uncertainty, and at the volumes a startup runs, that uncertainty dominates everything else in the calculation.
| Conversions in the window | Range the true cost per acquisition can sit in | What that means in practice |
|---|---|---|
| 10 | −46% to +109% | A $60 observed cost could truly be $125 |
| 25 | −32% to +55% | Nothing short of a 2× difference is visible |
| 50 | −24% to +35% | Big winners and big losers separate, nothing else |
| 100 | −18% to +23% | Roughly a fifth either way |
| 200 | −13% to +15% | First point where “slightly under budget” is real |
| 400 | −9% to +11% | Precision you will not need at this stage |
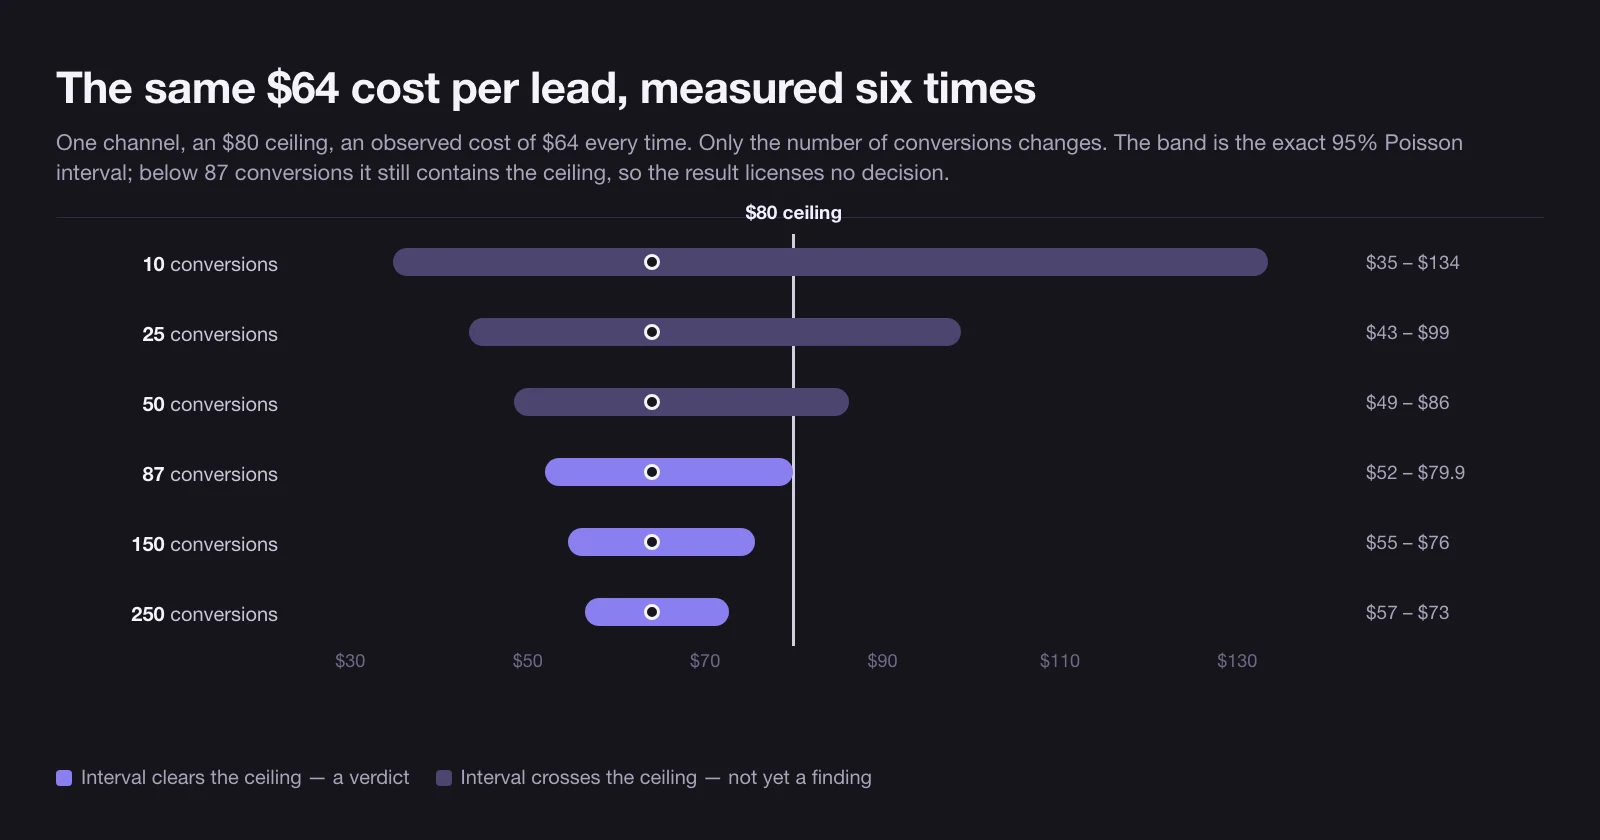
Method. Conversions in a fixed spend window behave as a count process, so an observed count N carries an exact 95% Poisson interval; because cost per acquisition is known spend divided by that count, the interval on the count inverts directly into the interval on cost. The figures above are the exact (Garwood) interval, computed for this article, not the normal approximation, which understates the width badly below about 30 conversions. The asymmetry is real and it always points the same way: the interval reaches further above the observation than below it. That does not mean the channel is probably worse than it looked — it means the bad case you have failed to rule out is the larger of the two.
This is the same square law that governs the sample size of a product-market fit survey — halving the gap you are trying to resolve roughly quadruples the volume you need. The statistic is different (a proportion measured against a fixed threshold there, a count here), but the practical consequence is identical, and it is the reason precision gets expensive so quickly.
The chart below re-cuts the same interval at the counts that matter against an $80 ceiling rather than at the round numbers in the table.
What one readable channel test actually costs
Turn the table around. Instead of asking what precision a given volume buys, ask what volume a given decision needs.
The decision is always the same shape: is this channel’s cost per acquisition below my ceiling? How much evidence that takes depends entirely on how far below the ceiling the channel lands.
| Where the channel’s observed cost lands | Conversions needed to prove it is under the ceiling | Cost of that test at the observed price |
|---|---|---|
| 50% under ($40) | 12 | about $500 |
| 40% under ($48) | 19 | about $900 |
| 30% under ($56) | 36 | about $2,000 |
| 25% under ($60) | 54 | about $3,200 |
| 20% under ($64) | 87 | about $5,600 |
| 15% under ($68) | 158 | about $10,700 |
| 10% under ($72) | 365 | about $26,300 |
Method. Each row is the smallest conversion count at which the exact 95% Poisson interval around the observed cost no longer contains the ceiling, computed for this article. Costs are that count multiplied by the observed cost per acquisition in the same row, not by the ceiling.
Two things fall out of this table, and both are decision rules rather than observations.
The first is that a channel which lands within about 15% of your ceiling is not worth resolving. Proving it takes ten thousand dollars and change on a twenty-thousand-dollar quarter, and the prize is a channel with almost no margin in it. A single-channel test will in fact resolve down to about 13%, as the next section shows — but that is a statistical floor, not a business one, and a channel with 13% of headroom is not a channel worth scaling. Treat “close to the ceiling” as a fail, not as an open question.
The second is that cheap answers come from big margins. A channel that is genuinely half your ceiling announces itself in twelve conversions. If a channel has not distinguished itself by the time you have spent a quarter of its allocated budget, the remaining three quarters are unlikely to change the verdict — they will narrow the band around a number that was never far enough from the line.
How many channels your first 90 days can afford to read
This is the division the frameworks never do.
Start from $20,000 for the quarter and an $80 cost-per-lead ceiling, and hold back 30% to scale whatever wins — because a test budget that leaves nothing for month three produces an answer you cannot act on. That leaves $14,000 of test money to be divided.
| Channels tested at once | Budget each | Leads each | Margin below the ceiling needed to get a verdict |
|---|---|---|---|
| 1 | $14,000 | 202 | 13% |
| 2 | $7,000 | 106 | 18% |
| 3 | $4,700 | 74 | 22% |
| 4 | $3,500 | 57 | 24% |
Method. Each row is the self-consistent solution, computed for this article: a channel that passes is cheaper than the ceiling, so it buys more leads than the ceiling price implies, and more leads lower the hurdle. The lead count shown is the number the budget buys at the margin shown, and the margin shown is the smallest one whose exact 95% Poisson interval clears $80 at that count.
Read the right-hand column as a hurdle. Testing four channels does not give you four answers; it gives you four channels that must each beat your ceiling by about 24% or return nothing. A channel coming in at 22% under budget — a genuinely good channel — is invisible in a four-way split and clearly a winner in a one-way test, with the same total money spent.
That is the whole argument for concentration, and it is not a matter of focus or discipline. It is that the number of channels you can read is your budget divided by your ceiling divided by the volume a verdict needs, and for most seed-stage companies that quotient is close to one.
The corollary matters as much: if the quotient really is one, the other channels are not being tested this quarter. They can still be run — a founder writing to fifty people costs no media budget — but they are being run on judgement, and it is worth saying so out loud in the plan rather than pretending every line item is an experiment.
Kill, scale, or keep spending: the three verdicts a channel test can return
Most advice offers two outcomes. There are three, and the third is where the money goes.
- Scale. The entire interval around the channel’s cost sits below the ceiling. Increase the spend, and expect the cost to rise as you exhaust the cheapest inventory — the next tranche of budget is a new test, not a continuation of this one.
- Kill. The entire interval sits above the ceiling. Stop, and record the observed cost so that the next quarter’s plan starts from evidence rather than from memory.
- Undecided. The interval crosses the ceiling. This is the common result, and it is not a soft fail — it is a statement that the test has not finished. The honest options are to keep spending until it resolves, or to stop for budget reasons and label the channel unresolved rather than bad.
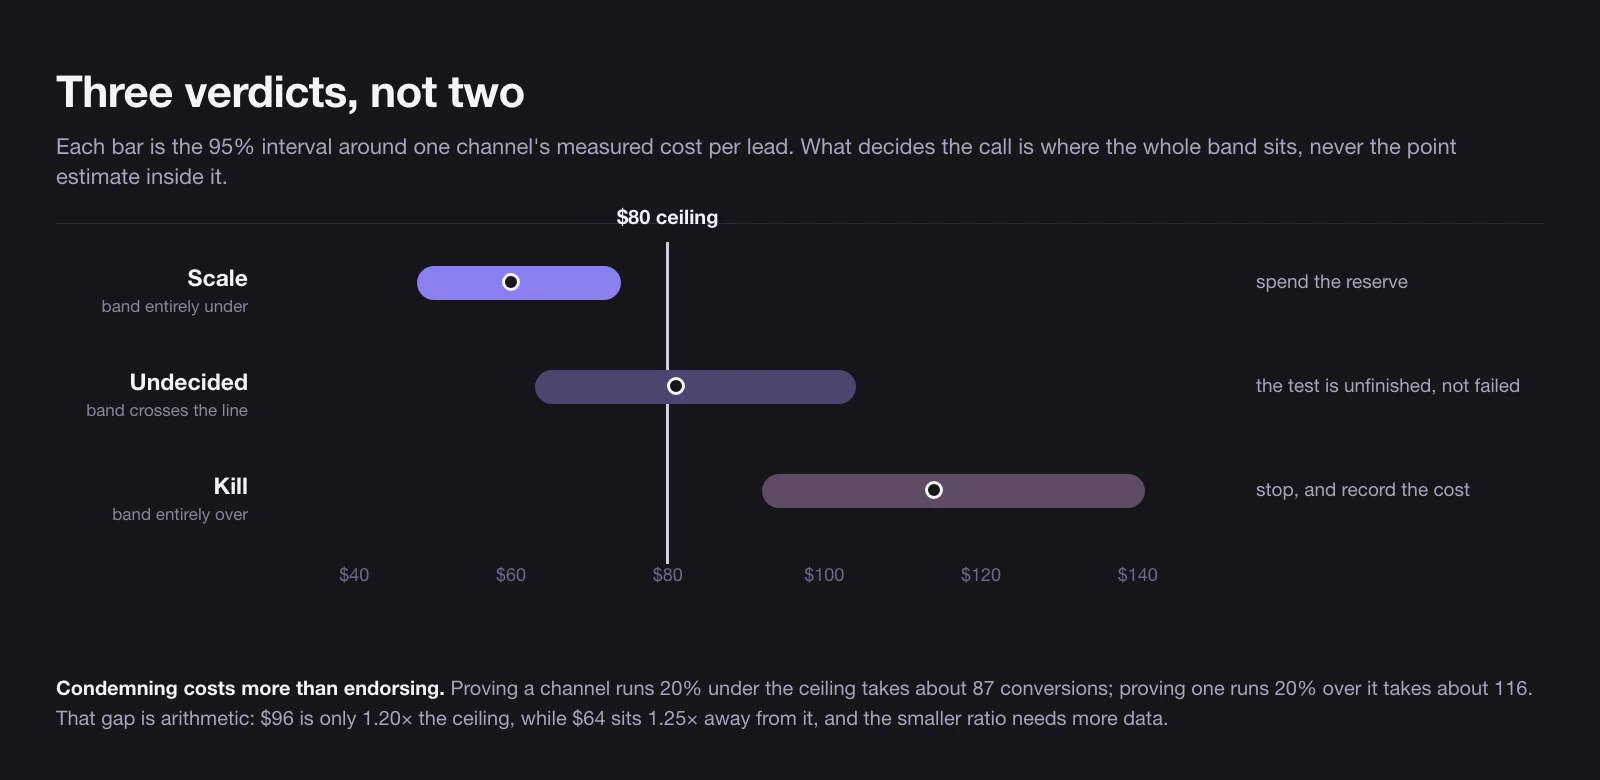
There is an asymmetry inside this that is worth planning around, and it is arithmetic rather than statistics. Condemning a channel takes more evidence than endorsing one the same percentage away from the ceiling. Proving a channel runs 20% under the ceiling — $64 against $80 — takes about 87 conversions; proving one runs 20% over it, $96 against $80, takes about 116. At 30% the pair is 36 and 56. The reason is that a percentage below the ceiling is a bigger ratio than the same percentage above it: $64 sits a factor of 1.25 from $80, while $96 sits only a factor of 1.20 from it, and the smaller ratio needs more data.
The practical consequence is that a formal kill verdict is usually not worth buying. Stop a channel when its budget is exhausted and its interval has not cleared the line, and call it unresolved. Reserve the extra spend for the channel that looks like it might clear.
Ordering channels by how fast they report back, not by how cheap they look
Within 90 days, a channel that cannot produce a verdict is not a cheap channel or an expensive one. It is a channel with no result. So the sequence should be set by what has to accumulate before the number means anything — which is a volume question on paid channels and a time question on organic ones.
| Channel | What has to accumulate before the number is readable | Source of the threshold |
|---|---|---|
| Paid search | At least 30 conversions in a trailing 30-day window | Google Ads Help, Target CPA and Smart Bidding guidance |
| Paid social | 50 optimisation events per ad set per 7-day period | Meta developer documentation on the learning phase |
| Cold outbound | A completed multi-step sequence, not a single send | Woodpecker platform data, see caveat below |
| Paid LinkedIn | The lead, plus a quarterly-average lag of 24 to 68 days before it becomes a qualified opportunity | HockeyStack Labs, 70+ B2B SaaS companies, $28M spend |
| Content and SEO | Rankings that, for most new pages, do not arrive inside a year | Ahrefs ranking study, 1M and 2M URL cohorts |
Three of those rows deserve their arithmetic done rather than quoted.
Paid social is the one most likely to be unaffordable. Meta’s own guidance is to structure ad sets so that each one reaches a minimum of 50 optimisation events over a 7-day period, and it warns that missing that threshold can push up your cost per result. Ninety days is about 12.9 weeks, so keeping a single ad set out of the learning phase for a quarter takes roughly 643 optimisation events. At an $80 cost per event that is about $51,000 — more than double the entire quarterly budget in this example. To make it fit inside $20,000 the optimisation event has to cost $31 or less, which means optimising on something further up the funnel than a qualified lead. That is a legitimate move, but it changes what you are measuring, and it means the channel’s headline cost per result is no longer the number you set a ceiling against.
Paid search fits, but it is not small. Google’s guidance is to “measure performance for the last 30 days, including at least 30 conversions.” That is a floor on the reading window rather than on the quarter: one valid read costs 30 conversions, about $2,400 at an $80 ceiling. Keeping a valid window open across the whole quarter means holding that run rate, which is 90 conversions or about $7,200 — affordable inside a $14,000 test budget, and also more than half of it. Worth knowing before you commit: what those conversions cost varies enormously by category, and what a click actually goes for in your vertical is the first thing to check, because a $12 click and a 3% landing page make an $80 lead arithmetically impossible.
SEO cannot be tested in a quarter, and the data on that is unusually clear. Ahrefs’ ranking study found that of 1 million random URLs its crawler first saw in September 2023, only 1.74% reached the top ten within a year; restricted to a separate cohort of 2 million URLs created in October 2023 with non-empty English content, 6.11% did. A third cut, of 1.3 million random US keywords, found 72.9% of pages currently in the top ten are more than three years old, with the average number-one page five years old. Note what those measure: ranking positions of randomly crawled URLs, not the performance of deliberate SEO on a commercial site. It is a statement about how hard the top of the results page is to enter, not a promise that your content will take n months. But it settles the sequencing question. Content started in the first 90 days is a bet whose result lands in a later quarter, and it should be budgeted as one, not framed as a test.
The one channel this framing tends to undersell is the founder’s own time. In High Alpha’s sample, operators under $1M ARR named events (45%), outbound (34%) and organic search (33%) as their most effective routes — a measure of what people select as effective, not a share of customers or of spend, and worth reading as such. What the three have in common is that they run on labour rather than media, which is why they dominate at exactly the stage when the media budget cannot buy a readable test.
The 90 days as one page
Putting the pieces in order, for the worked example above — $20,000, an $80 lead ceiling derived from a $1,600 CAC ceiling and a five-month payback target:
- Weeks 1–2. Fix the ceiling and the conversion definition. Write down the CAC ceiling, the funnel step you will measure, and what disqualifies a lead. Do this before any spend, because changing the definition mid-quarter destroys the comparison.
- Weeks 1–12. Run the unmeasured channels deliberately. Founder outbound, conversations, events. No media budget, no verdict expected, and say so in the plan.
- Weeks 3–10. Test one paid channel to a verdict. Pick the one where your buyers demonstrably are and where your ceiling is plausible, and commit the whole $14,000 test budget to it — roughly 200 leads at the price a passing channel actually charges. Do not add a second paid channel because the first is ambiguous; ambiguity means it is unfinished, not that it is wrong.
- Week 10. Read the interval, not the point estimate. Below the ceiling by more than 15%, scale. Above it with the whole band clear, stop. Crossing the line, label it unresolved and decide on budget grounds.
- Weeks 10–12. Spend the reserve on whatever cleared. The 30% held back exists for this, and its performance at higher spend is a new question, not the same one.
- Start content in week 1 and do not judge it this quarter. Its result belongs to the quarter after next.
The document all of this lives in is not a special artefact. It is the launch section of an ordinary operating plan, and once the quarter is over it folds into the same marketing plan that carries everything else. Templates are fine for making sure no section is missing. They are not where the decision is made.
One sequencing point is worth stating plainly, because it sits underneath all of the above. Channel tests find where your buyers are; they do not create demand that is not there. If your product has not yet reached the point where losing it would disappoint a meaningful share of the people using it, scaling a winning channel scales the wrong thing — you buy, at cost and at volume, more confirmation that the product is not yet a must-have. Test channels early, at small volume, to learn the map. Scale them after the fit question has an answer.
What the published channel benchmarks do and do not tell you
If you plan against numbers you found in a benchmark table, it is worth knowing which of them have a sample behind them.
The ones that do: WordStream’s Google Ads benchmarks disclose 16,446 US search campaigns running April 2024 to March 2025, with at least 64 campaigns per category, and state plainly that the “averages” are medians used to suppress outliers — a self-selected population of advertisers using one vendor’s tooling, but an honest one. HockeyStack’s LinkedIn report discloses 70-plus B2B SaaS companies and $28 million of spend, with the important caveat that the sample floor is $5M ARR: those are not seed-stage economics, and a pre-revenue company should not plan against them. High Alpha and SaaS Capital both disclose respondent counts and describe their figures as self-reported.
The ones that do not: the most widely copied cost-per-lead tables on the web come from an SEO agency whose entire stated methodology is that the report “was prepared by our marketing research team, based on data collected between January 2022 through June 2025” — no company count, no collection method, no per-industry sample. Those figures are then republished by a large marketing platform that runs no survey of its own, which gives the same undisclosed dataset the appearance of independent corroboration. For B2B SaaS the two renderings of that dataset disagree with each other: the paid and organic cost-per-lead figures are transposed between them, so at least one is wrong and neither discloses enough to say which. Cold email benchmarks have a related problem in a milder form: Woodpecker’s platform data is real and the corpus is large — the company describes it as over 20 million sales emails across more than 1,000 customers — but it publishes no date range for that corpus and blends in figures published by three competitors, and a sequencing tool reporting that sequencing improves reply rates is not a neutral finding.
Two rules of thumb in this category are worth naming as such. The 3:1 lifetime value to CAC ratio comes from a 2013 blog post by an investor who described his figures as “early guesses” that later held up in his portfolio; there is no study behind it, and it is structurally unusable in a first quarter anyway, because lifetime value needs a churn rate you cannot yet have measured. The 95-5 rule — that 95% of business buyers are not in the market at any moment — is arithmetic derived from an assumed five-year repurchase cycle, and its author states that the figure “is not meant to be a precise rule.”
None of this makes external benchmarks useless. It makes them a prior, not a target. The only cost per acquisition that governs your decisions is the one your own channel produced, with its own interval attached — which is why the volume the interval needs is the number the whole plan should be built around.
Narrowing a launch to the one channel a budget can actually read, and setting the ceiling it gets judged against, is the work we do with early-stage companies before any money moves.
10 / Reader questions
Frequently asked questions
01What is a go-to-market strategy for a startup?
A go-to-market strategy for a startup is the decision about which channels get money, how much each one gets, and what evidence stops or scales it. Frameworks describe the pieces — audience, positioning, pricing, distribution. The part that decides the outcome is the budget split, because it determines which channels ever produce a readable result.
02How much should a startup spend on each marketing channel in the first 90 days?
Enough for one channel to reach 50 to 250 conversions, which is the range that covers most realistic margins against a ceiling. At a cost-per-lead ceiling of 80 dollars that is 4,000 to 20,000 dollars per channel, and since a sane plan holds back roughly 30% to scale the winner, the practical top end on a 20,000-dollar quarter is about 14,000.
03How many marketing channels should a startup test at once?
Usually one, occasionally two. Divide the test portion of your 90-day budget by your target cost per acquisition, then by the conversions a verdict needs at the margin you expect. Most seed-stage budgets return a quotient close to one. Splitting the same money four ways does not buy four answers, it buys four intervals too wide to act on.
04How long does it take to know if a marketing channel is working?
It depends on volume, not on time. Paid search needs at least 30 conversions in a trailing 30-day window before Google considers the performance measurable. Meta asks for 50 optimisation events per ad set per week. Content and SEO cannot clear that bar inside 90 days at all, which is a reason to sequence them differently rather than to skip them.
05When should you kill a marketing channel?
When the whole confidence interval around its cost per acquisition sits above your ceiling, not when the point estimate does. That takes more evidence than approving one the same percentage from the ceiling: proving a channel is 20% worse than your ceiling needs about 116 conversions, while proving it is 20% better needs about 87.
06Do you need product-market fit before a go-to-market strategy?
You need it before you scale spend, not before you test channels. Below the fit threshold, acquisition money mostly buys people who confirm at cost that the product is not yet a must-have. Channel tests are still worth running at small volume, because their job is to find where your buyers are, not to grow the business yet.
07What is the difference between a go-to-market strategy and a marketing plan?
A go-to-market strategy covers one launch into one market: who the buyer is, what the offer is, and which route reaches them. A marketing plan is the recurring operating document that survives after the launch, covering all products, all segments and a full budget year. The go-to-market strategy usually becomes a section of it.
08Are go-to-market strategy templates worth using?
As a checklist of sections, yes. As a decision tool, no. Every published template asks you to name your channels, and none of them tells you the minimum spend at which a named channel returns an interpretable number. That gap is where most 90-day launches are lost, and no template fills it.