Published
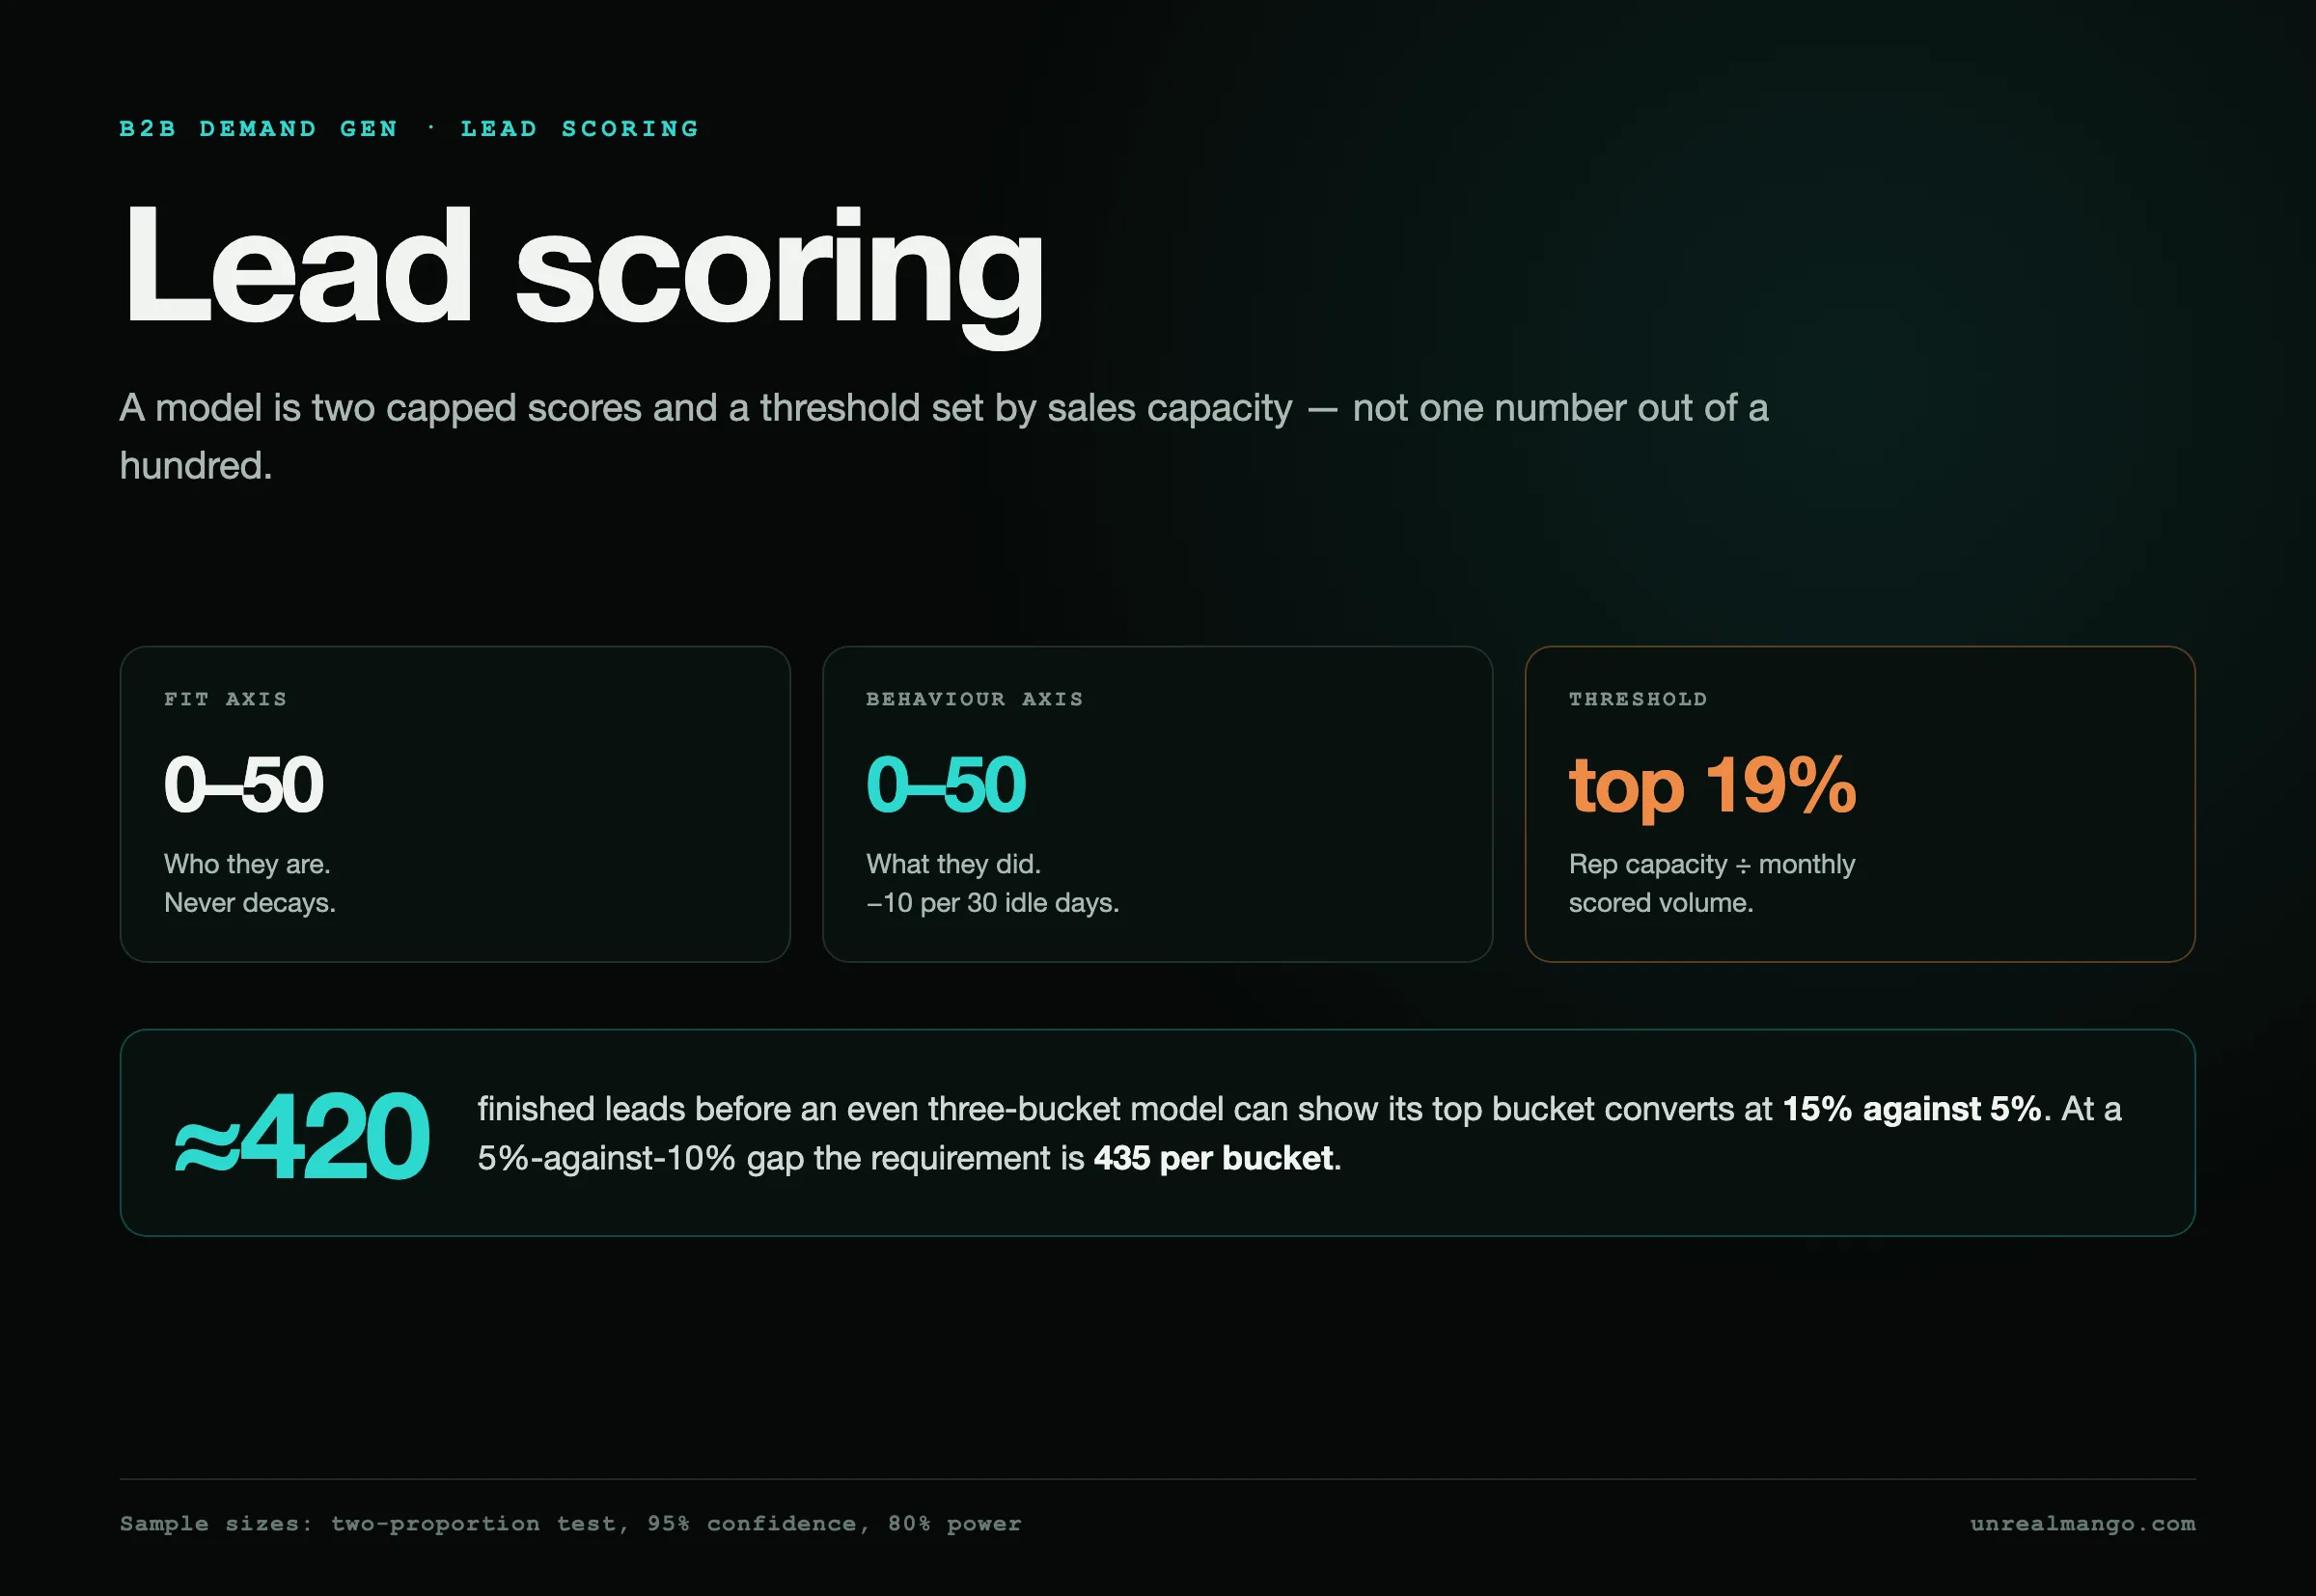
Lead scoring assigns points to a lead for who they are and what they have done, so sales works the top of the list first. A working model keeps two scores, not one — fit and behaviour — and it proves nothing at all until enough scored leads have finished a full sales cycle to tell its buckets apart.
How this was checked. For this search in the United States on 23 August 2026, Google returns an AI Overview, an image pack of nine model diagrams and eight organic results: HubSpot’s knowledge base and its product page, Oracle, Salesforce, Wikipedia, Agile CRM, ActiveCampaign and LeadsBridge. All eight define lead scoring. The starter weights, the negative points, the capacity threshold and the sample-size test below are ours: sample sizes are computed from the standard two-proportion test at 95% confidence and 80% power, the formula named where it is used, and the worked example is illustrative arithmetic with every input stated, not a set of client books.
About 420 leads have to finish a sales cycle before a three-bucket model can prove its top bucket beats its bottom one — and that is under the friendly assumption of 15% against 5%. If the real separation is 5% against 10%, the requirement is 435 leads per bucket, roughly 1,300 in total. Below those volumes a scoring model is a sorting convention. It may still be a useful one, but nobody can say whether it works, and most of the arguments about weights that consume a quarter are arguments about noise.
Fit and behaviour are two scores, and collapsing them into one is the first mistake
Fit answers whether this company is one you can sell to: role, headcount, industry, region, budget authority, technology. Behaviour answers whether they are moving right now: pages, forms, replies, sessions. Both matter, and they fail in opposite directions when added into a single number.
A single 100-point score lets a perfectly-shaped company with no activity land in the same place as a student who read nine blog posts on a Sunday. Those two leads need opposite handling — one gets a call, the other gets nothing — and a single number cannot express that, because it has already thrown away which half of the points came from where.
Keeping the axes separate gives you four quadrants instead of one ranking, and each quadrant has a different owner. High fit with high behaviour goes to sales today. High fit with low behaviour goes to a nurture track, because the account is right and the timing is not. Low fit with high behaviour is the trap quadrant — busy, flattering, and usually students, competitors and job seekers. Low fit with low behaviour stays where it is.

A starter model: fourteen signals and the points they carry
This is a model to copy into a CRM in an hour and then correct with your own data, not an answer. The point of starting here rather than from a blank sheet is that the shape is right — two capped axes, weights that are ordered sensibly against each other — and only the numbers need fixing.
Fit, maximum 50 points.
| Signal | Points | Why this weight |
|---|---|---|
| Job title matches a buying-committee role | 12 | The single strongest fit predictor in most B2B sets |
| Headcount inside your ICP band | 10 | Cheap to verify, hard to fake |
| Industry on your served list | 8 | Coarse but stable |
| Country or region you actually serve | 6 | Binary in practice; treat a miss as disqualifying |
| Budget authority stated on the form or a call | 8 | Self-reported, so weight it below observed facts |
| Runs a platform you integrate with | 6 | High precision where it applies, blank for most leads |
Behaviour, raw points 55, capped at 50.
| Signal | Points | Why this weight |
|---|---|---|
| Demo or contact form submitted | 15 | Declared intent, the strongest behavioural signal |
| Pricing page viewed | 12 | Closest thing to a purchase question on most sites |
| Three or more sessions within 30 days | 8 | Repetition, not a single accident |
| Case study or comparison page viewed | 6 | Evaluation stage, weaker than pricing |
| Replied to an email | 5 | A human, verified |
| Attended a live webinar past the halfway point | 4 | Time spent, but often a peer audience |
| Content download | 3 | Counted once, no matter how many PDFs |
| Email click followed by a site session | 2 | See the bot note below |
The cap is the part that does the work. Raw behaviour can reach 55, but the axis stops at 50, so no amount of clicking lets activity outrun a complete fit profile. Cap the axis rather than the individual signal: capping signals one by one invites an endless argument about each, while one ceiling per axis holds the balance between them permanently.
Two weights are deliberately low. A content download is worth three points and is counted once, however many assets the person takes — the gated-asset problem is covered in more depth in our comparison of marketing and sales qualified leads, and the practical consequence for a scoring model is simply that downloads must never be able to stack. Email opens are absent from the table entirely. Apple’s Mail Privacy Protection, live since September 2021, pre-fetches remote images through a proxy, so an open registers whether or not a person ever looked at the message. Corporate security scanners do the same to links, which is why a click only counts here when a site session follows it.
Where the weights come from: lift against your own closed deals
Every number above is a placeholder for one you can measure. The measurement is a ratio, and it takes one export.
Pull every lead from a period long enough to have closed — twelve months for a 60-day cycle — with the signal fields and the final outcome. For each signal, compute the close rate of leads that had it and the close rate of leads that did not. The ratio between those two is the signal’s lift. A signal whose lift is 3.0 belongs near the top of your table; a signal at 1.1 is noise wearing a point value; a signal below 1.0 is a negative that has been sitting in your positive column.
Convert lift to points by keeping the order and scaling to the cap rather than by any formula that looks precise. Rank the fit signals by lift, then distribute 50 points across them so the ordering matches — the highest-lift signal gets the largest share, and the gap between two signals in the table reflects the gap in their lift. Precision beyond that is false: the lift figures themselves come with confidence intervals wide enough to swallow any third decimal place.
The same export answers a question most teams never ask, which is whether a signal has enough volume to be worth a row at all. A signal present on eleven leads out of two thousand cannot move a ranking regardless of its lift, and it will produce a spectacular-looking ratio that vanishes next quarter.
Six signals that should subtract points
Almost every published model is additive only, which guarantees that scores drift upward over time and that the top of the list slowly fills with leads nobody can sell to. Negative points are not a refinement; without them the model has no way to express “this is actively wrong”.
| Signal | Points | Effect |
|---|---|---|
| Competitor domain in the email address | −40 | A knockout at any threshold above 60: the ceiling of 100 minus 40 leaves 60 |
| Title contains student, intern, professor or job seeker | −15 | The largest source of high-behaviour, zero-value leads |
| Unsubscribed from marketing email | −12 | An explicit withdrawal, and in most jurisdictions a compliance boundary too |
| Email address hard-bounced | −10 | The lead is unreachable, whatever the rest of the profile says |
| Headcount far below the ICP floor, one to four people | −10 | Distinct from being outside the band: this is a different buying process |
| Free email provider on a business form | −8 | Weak on its own, useful in combination |
Only one of those is worth an automatic exclusion rather than a penalty, and it is the competitor row. The rest should stay as arithmetic, because a penalty large enough to matter still allows an exceptional lead to clear the threshold, while a hard exclusion rule fails silently the day someone at a target account happens to use a personal address.
Behaviour decays, fit does not
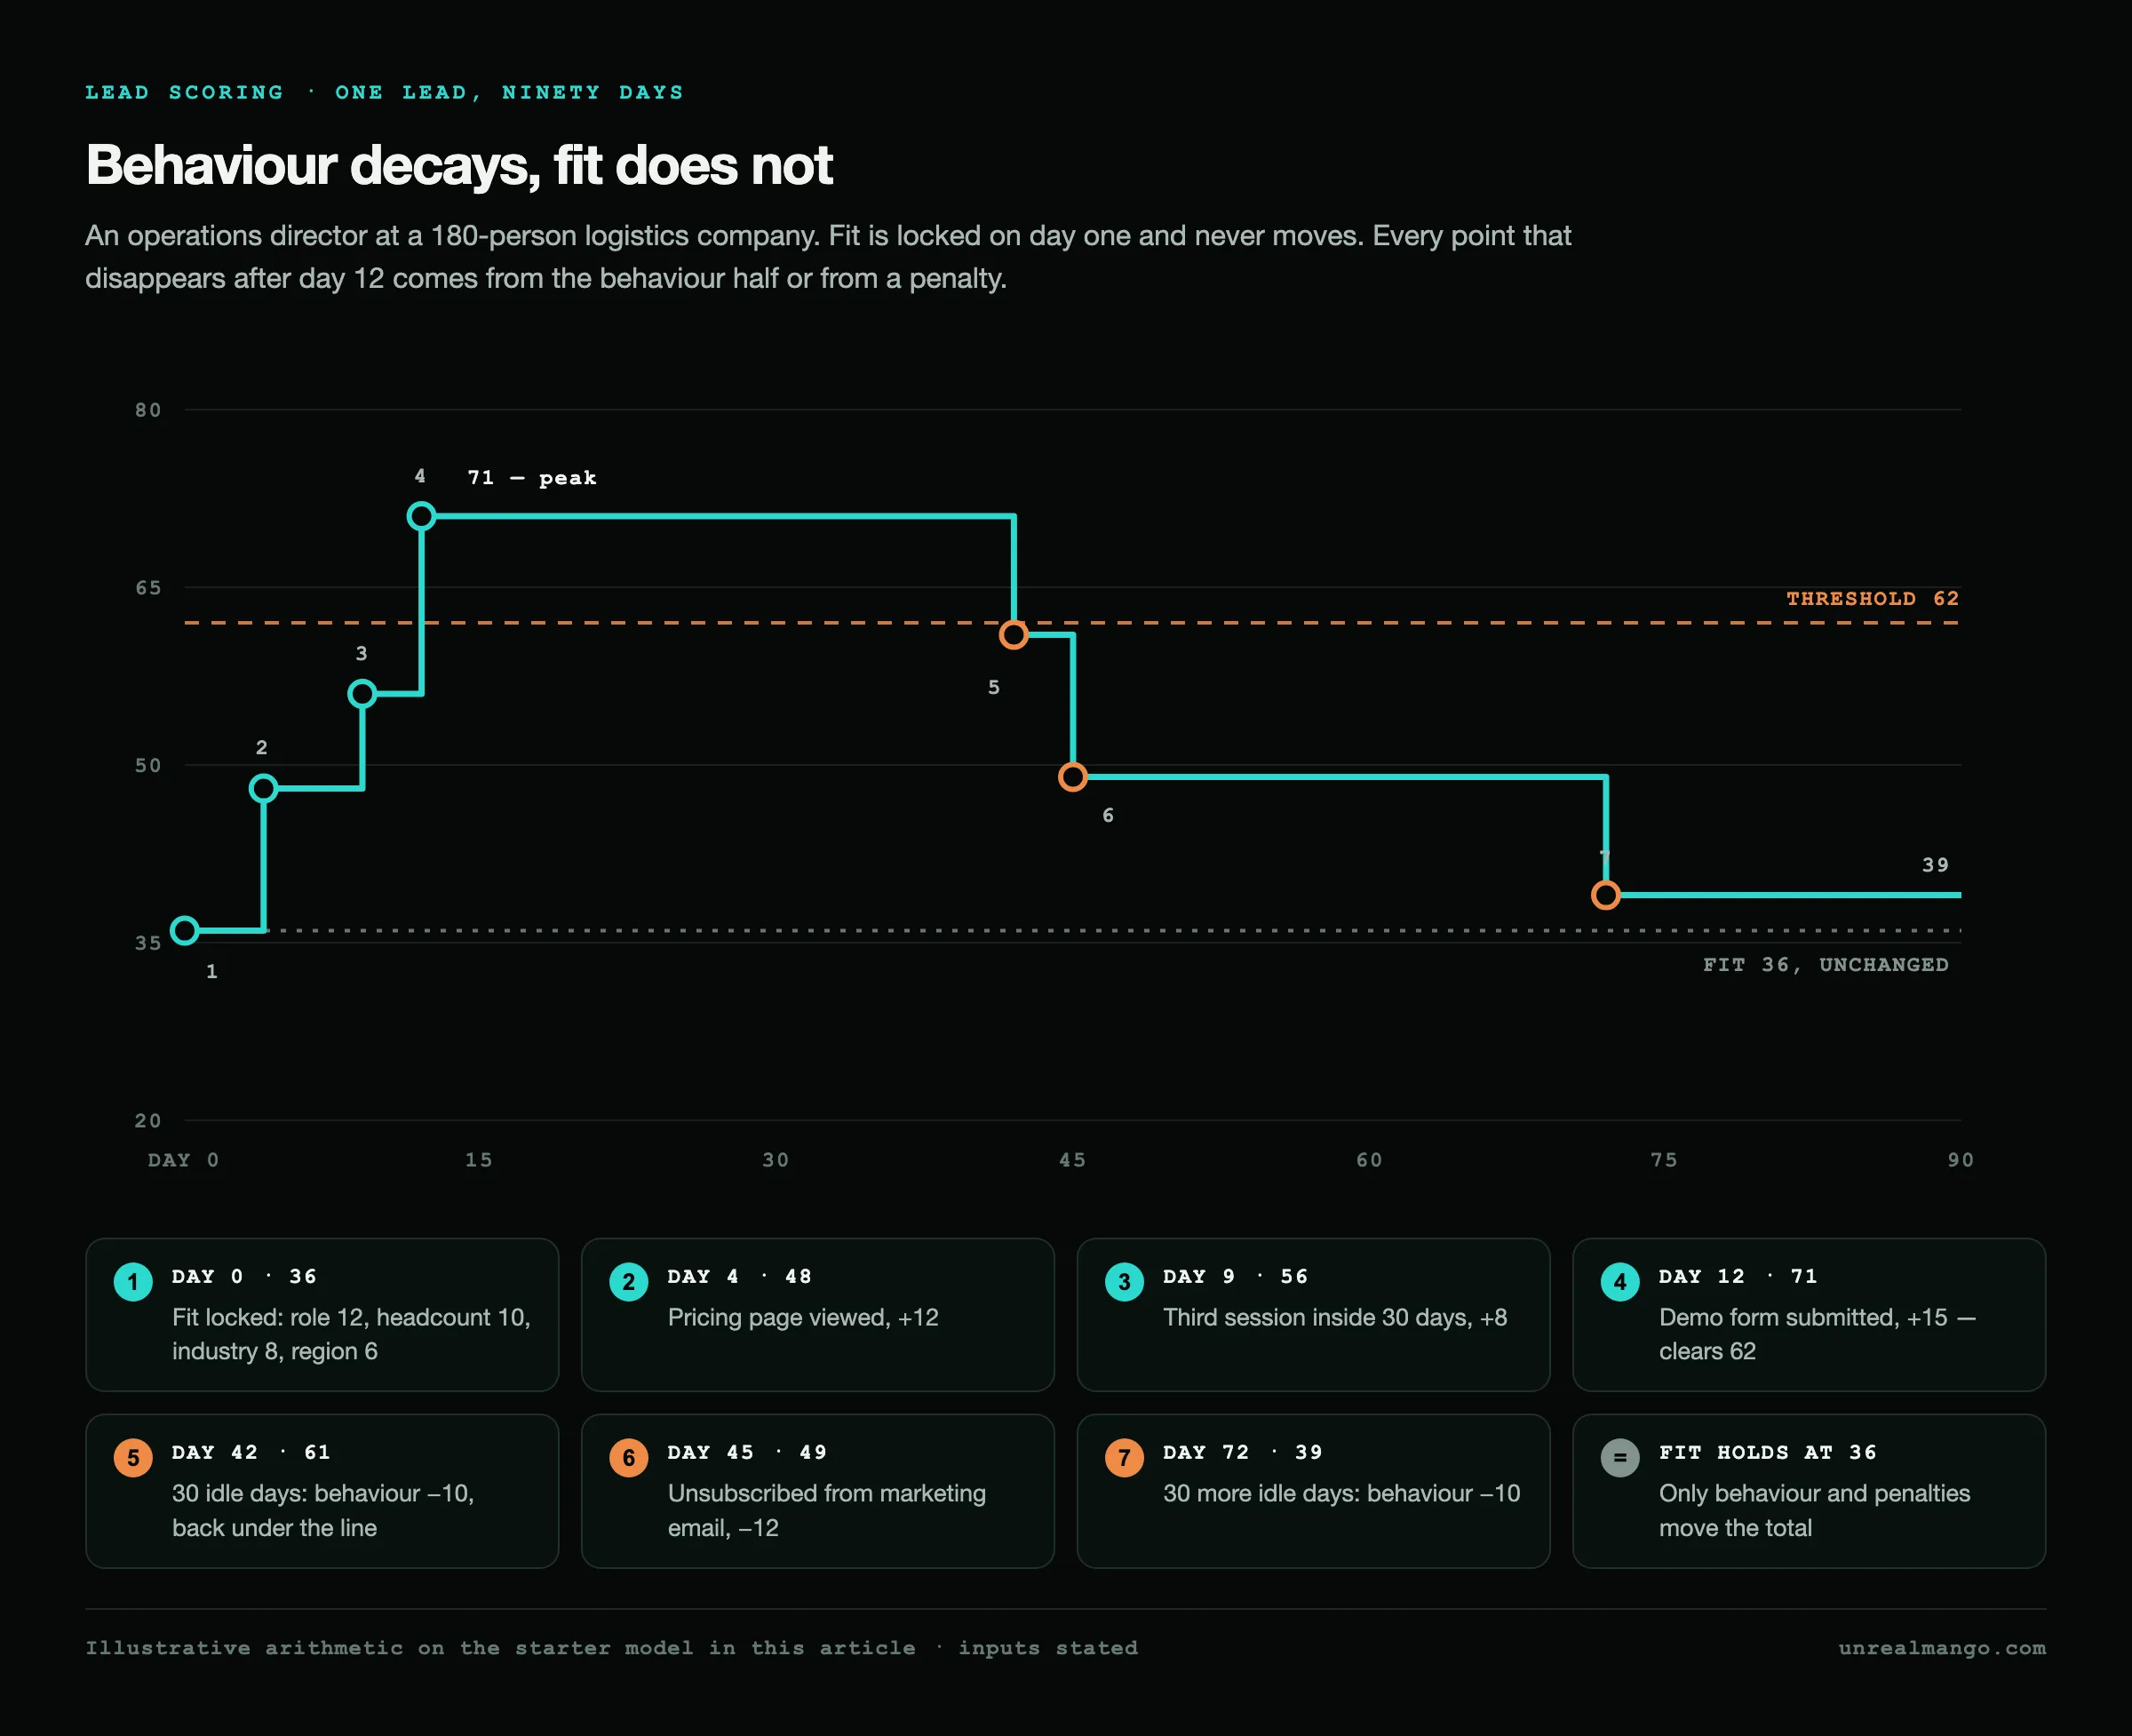
A score with no half-life is a running total, and a running total only goes up. Six months after launch the top of the queue is occupied by leads whose activity happened last spring, and the reps stop trusting the ordering — usually without saying so, which is how a scoring project dies quietly.
The rule that fixes it is asymmetric, and the asymmetry is the point. A director of operations at a 180-person company is still a director of operations at a 180-person company in March; fit does not go stale on any timescale that matters to a sales cycle. Three pricing page visits from January say nothing whatsoever about intent in March. So behaviour decays and fit does not.
Ten behaviour points per thirty idle days, with a floor of zero on that axis, empties a full behaviour score in five months of silence and leaves the fit score untouched. Any activity resets the clock. The exact rate matters far less than having one: the practical test is whether a lead that went quiet three months ago still outranks one that requested a demo this week.
The threshold is your sales team’s monthly capacity, not a round number
Thresholds get set at 100 because the scale runs to 100. That number has no relationship to anything happening in the business, and it produces one of two failures within a quarter: either far more leads clear it than the team can work, in which case the score sorts a queue nobody reaches the bottom of, or far fewer clear it than the team has hours for, and reps go back to working the raw list.
The threshold is a capacity calculation. Count reps, multiply by the number of new leads each can properly work in a month — properly meaning a real sequence of attempts, not a single call — and divide by monthly scored volume. That share, taken off the top of the score distribution, is your threshold.
Three reps who can each work 25 new leads a month have a capacity of 75. Against 400 scored leads a month, 75 is the top 19%, so the threshold is whatever score sits at the 81st percentile of the distribution — in the example model that landed at 62 points, but the percentile is the rule and the number is an output. It moves when you hire, when a rep leaves, and when volume changes. Recomputing it takes a minute and should happen every quarter, which makes it the cheapest recurring maintenance in the whole system and, in our experience running marketing strategy for small teams, the one most often skipped.
One consequence is worth stating plainly, because it is counterintuitive: the same lead can be above the line in a month when volume is low and below it in a busy month. That is correct behaviour. The threshold is a triage instrument for a fixed number of selling hours, not a verdict on the lead.
How many leads before the score stops being noise
This is the question the model has to answer before any of the weights above deserve an argument, and it is missing from every page currently ranking for this term.
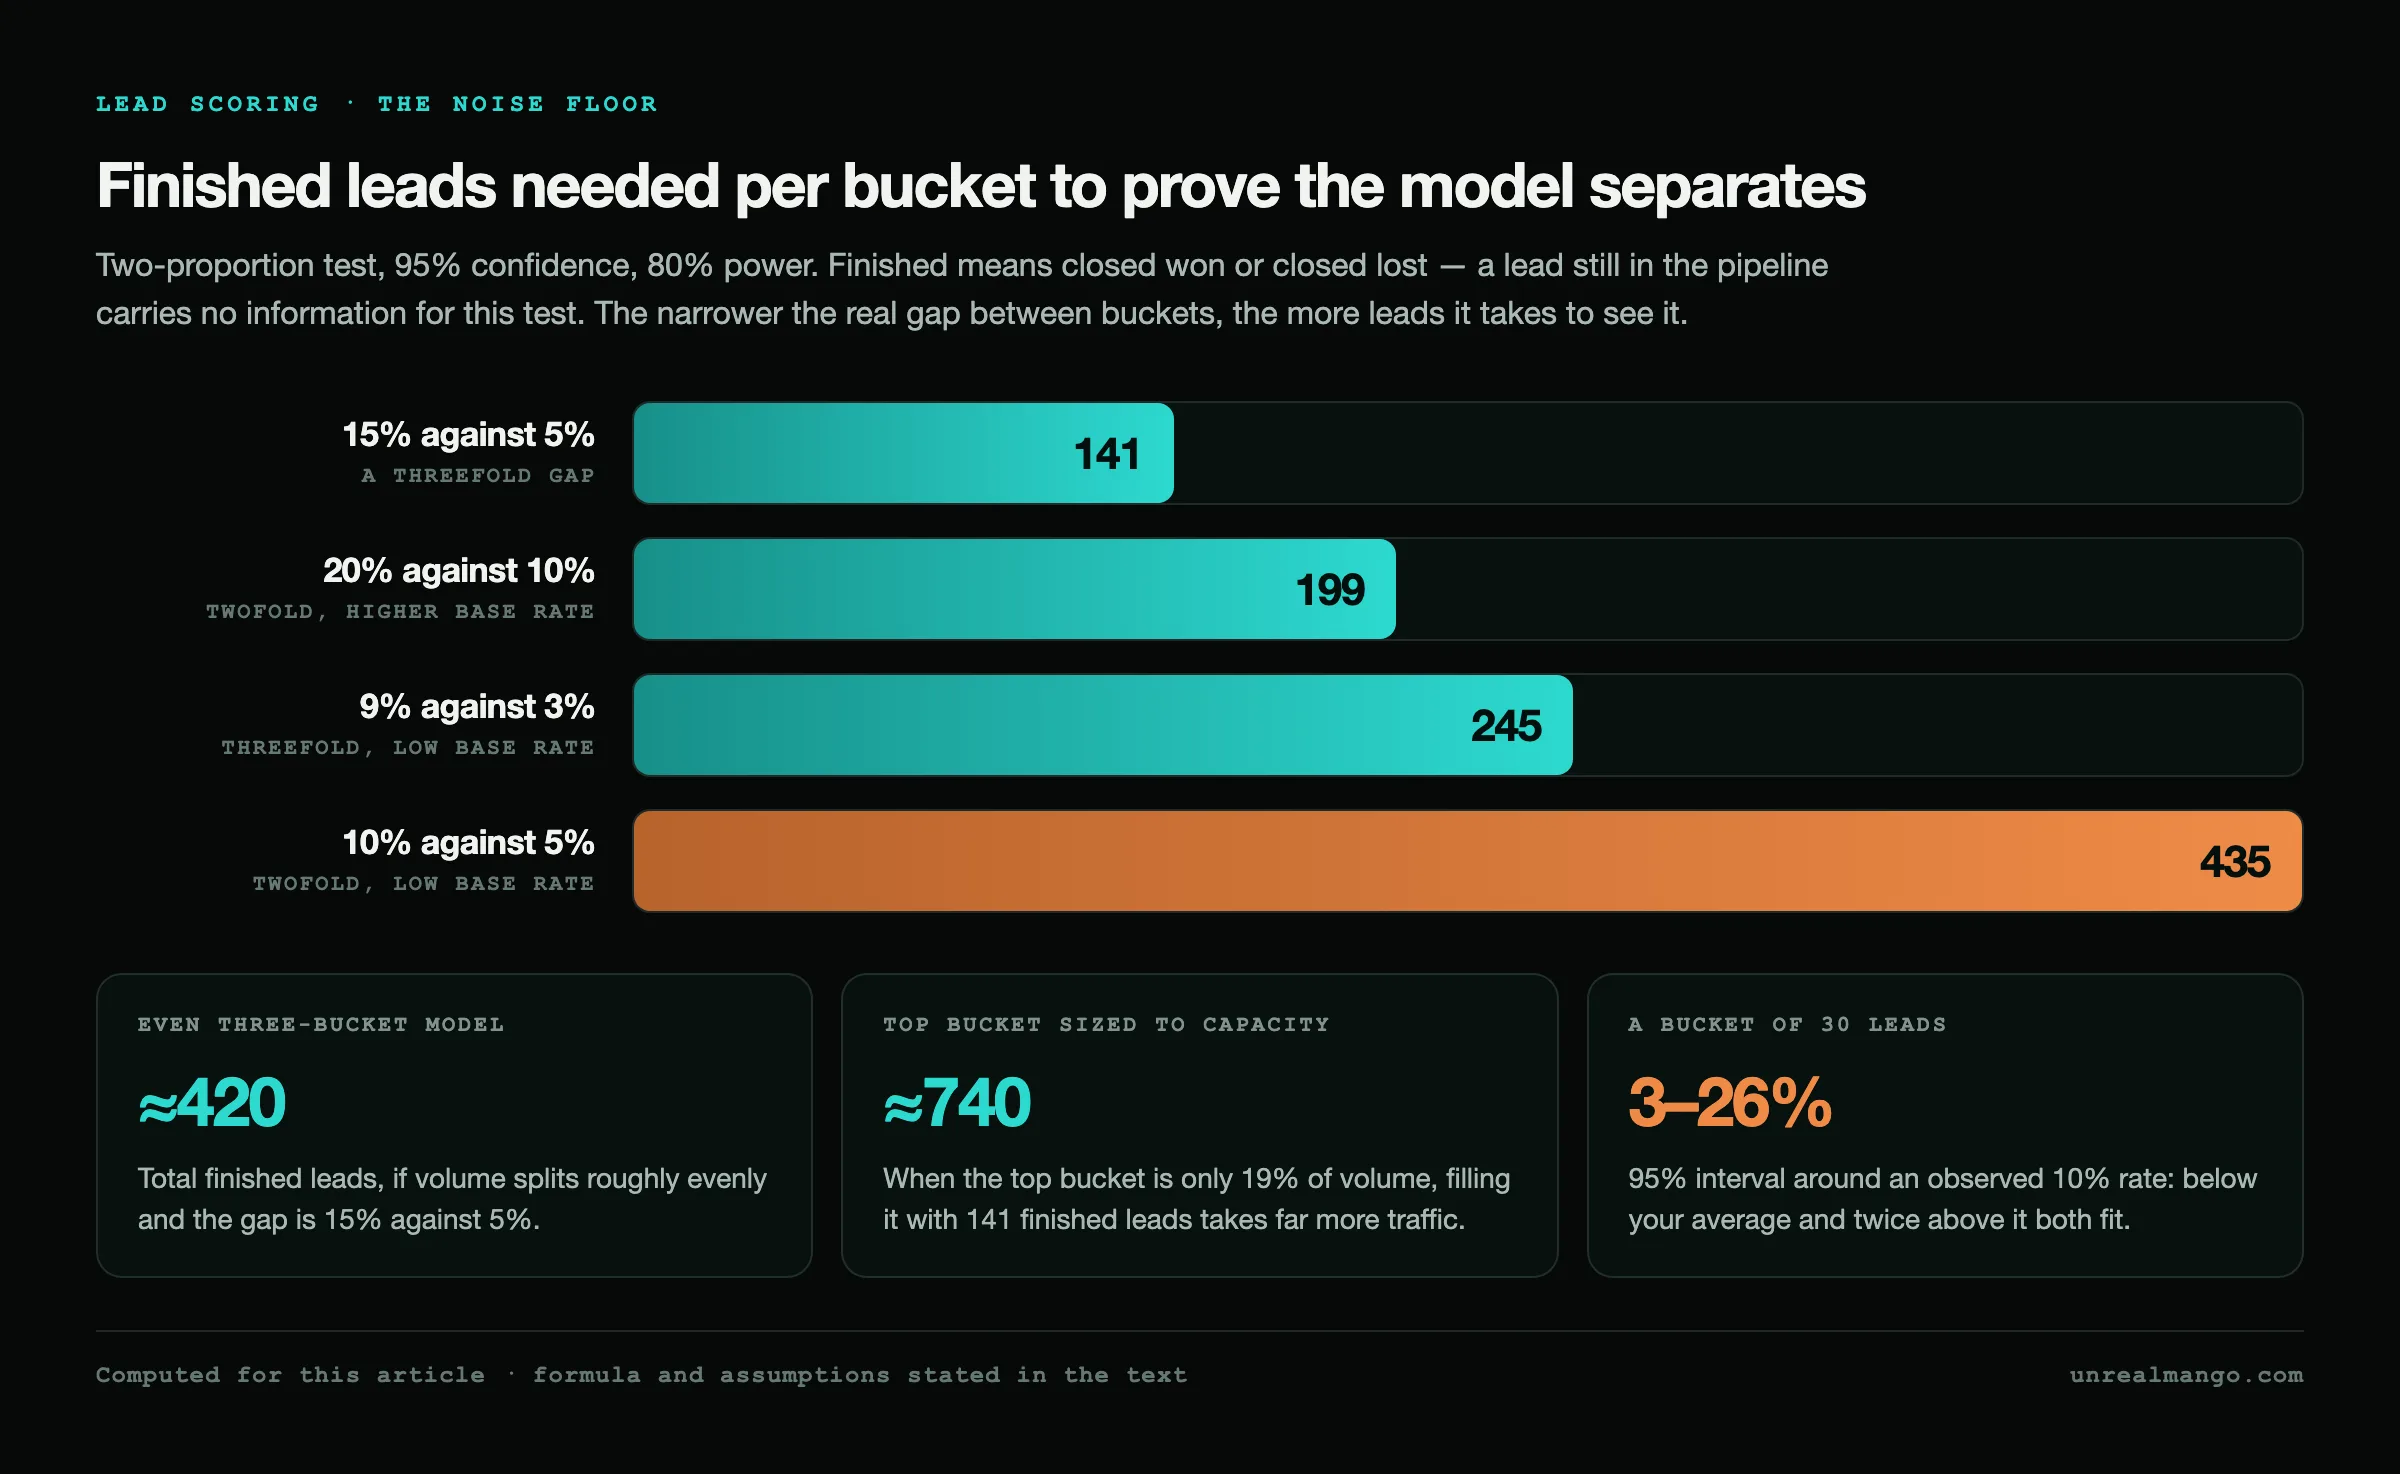
A scoring model makes a testable claim: leads in the top bucket close at a higher rate than leads in the bottom bucket. Testing it is a comparison of two proportions, and the sample size needed follows from how big the gap is. At 95% confidence and 80% power:
| Claim being tested | Finished leads needed per bucket |
|---|---|
| Top bucket 15% against bottom bucket 5% | 141 |
| Top bucket 20% against bottom bucket 10% | 199 |
| Top bucket 9% against bottom bucket 3% | 245 |
| Top bucket 10% against bottom bucket 5% | 435 |
Finished means closed won or closed lost, not merely created. A lead still in the pipeline carries no information for this test. The figures come from the pooled two-proportion sample-size formula, n = (z0.975√(2p̄(1−p̄)) + z0.80√(p₁(1−p₁) + p₂(1−p₂)))² ÷ (p₂ − p₁)², where p̄ is the average of the two rates.
Even buckets make roughly 420 leads sufficient for the friendliest of those cases. Buckets are rarely even, though, because the top one is deliberately sized to sales capacity. In the example above the top bucket is 19% of volume, so collecting 141 finished leads inside it requires about 740 leads in total. At 400 leads a month that is a few days under two months of collection, plus one full sales cycle before the last of them resolves — call it four months from launch to the first honest verdict.
What happens below those volumes is not a smaller version of the same answer. A bucket holding 30 leads with three closed deals shows a 10% conversion rate whose 95% interval runs from roughly 3% to 26%: the same observation is consistent with a bucket performing below your overall average and with one performing more than twice as well. At 100 leads the interval is still ±5.9 points. This is why so many scoring models get rebuilt every quarter on evidence that never existed, and why the honest move under a hundred closed deals is to write the weights by hand from lift, ship them, and leave them alone until the data arrives.
Backtesting the model: bucket conversion, decile lift and what a dead model looks like
Once the volume exists, two instruments answer whether the model works, and they operate on different timescales.
The bucket test is the quarterly one. Take every lead that finished in the period, group by the bucket it was in at the moment sales first touched it — not its score today, which has moved — and compute the closed-won rate of each group. A working model produces a monotonic gradient: top above middle above bottom, with the top-to-bottom ratio at least the factor you sized the sample for. A model that has stopped working produces a flat line or an inverted one, and the inverted case is more common than it sounds, because it is what a fit skew looks like when your best-converting segment scores badly.
Decile lift is the annual instrument. Rank every lead by score, cut into ten equal groups, plot the close rate of each. It is a far more informative picture and it needs far more data: on 400 leads a month, one month gives 40 leads per decile and a ±9.3-point interval at an observed 10% — unreadable. A full year gives 480 per decile and ±2.7 points, which is a chart you can act on. Run buckets quarterly, deciles annually, and do not confuse the two.
The third check is the cheapest and gets skipped: the field-coverage audit. Count how many scored leads have each signal field populated at all. A fit signal present on 30% of leads is contributing points to 30% of your ranking and silently penalising the rest, which is a data problem masquerading as a modelling one.
Four ways a working scoring model quietly breaks
One asset pulls a lead to the top. A guide that gets shared internally at a target account sends a stream of downloads and page views from people who are not evaluating anything. The download cap and the axis cap both exist for this; without them, a single popular PDF reshapes the queue for a month.
Automated traffic inflates behaviour. Opens are pre-fetched, links are pre-clicked by scanners, and both arrive with plausible timestamps. Excluding opens outright and requiring a session behind every click removes most of it. The residual shows up as leads with high behaviour scores and zero session duration — worth a monthly query.
Fit weights bury a segment that converts. A model tuned on enterprise deals scores a 40-person company low on headcount, low on budget authority and low on tech stack, and never lets it clear the threshold, so it never produces a closed deal to argue with. The gradient looks healthy while an entire segment is invisible. The bucket test cannot catch this; only a periodic look at what closed outside the top bucket can.
Fields drift. Someone edits a form, renames a picklist value, or adds an option, and the rule matching that value silently stops firing. Points quietly stop being awarded and the distribution shifts down. Any change to a form or a CRM picklist that a scoring rule reads should force a check of the score distribution the following week.
When predictive scoring is worse than the rules you wrote by hand
Predictive scoring — a model fitted to your own closed-won history rather than to weights you chose — is genuinely better than rules once its conditions are met. The conditions are the part vendors leave out.
It needs several hundred closed-won deals, not leads, and needs them from a period whose ICP still resembles today’s. It needs the fields it reads to be populated consistently across that whole period, which excludes most CRMs that have been reorganised in the past year. And it needs the outcome to be independent of the features: a model that learns “had a demo” predicts closed-won superbly and tells you nothing, because the demo is downstream of the decision it claims to forecast. That leakage is the most common failure in an in-house predictive build and the hardest to spot, because it makes the accuracy metrics look excellent.
Three situations argue for hand-written rules regardless of data volume: an ICP that has changed inside the last two quarters, a strongly seasonal business where last year’s pattern misleads, and a launch into a new market where the historical data is about a different buyer. Third-party intent signals are sometimes proposed as a substitute for volume here; they are a different input with their own coverage limits, and worth treating as a separate question from how the model itself is built.
Who owns the model, and what triggers a rebuild between quarters
A scoring model with no named owner degrades on a predictable schedule, because every input it reads belongs to someone else. One person — usually marketing or revenue operations — owns the weights, the threshold and the quarterly review, and that ownership is worth writing down somewhere both teams can see.
The quarterly review is short: recompute lift on the last four quarters of closed deals, adjust weights only where the ordering has actually changed, recompute the capacity threshold against current headcount and volume, and run the bucket test. Most quarters this changes one or two numbers.
Four events justify a rebuild before the quarter is up: the ICP changes, a new pricing tier or product line lands, entry into a market the historical data does not describe, or a shift of more than about a fifth in channel mix — because the same score means something different when it is earned through paid search rather than referral. Routine automation changes such as a new nurture branch do not qualify, though the threshold used to exit nurture should be read from the same model rather than set separately, which is the single most common place for two definitions of “ready” to drift apart.
12 / Reader questions
Frequently asked questions
01How do you calculate a lead score?
Add the fit points a lead earns for who they are and cap that at 50. Add the behaviour points they earn for what they did, cap that at 50 as well, then take ten off the behaviour half for every thirty days of silence. Subtract the penalties from the total. Score = min(fit, 50) + max(0, min(behaviour, 50) − decay) − penalties, floored at zero.
02What is lead scoring in marketing?
Lead scoring is a ranking system that assigns points to each lead so the sales team works the strongest ones first. Points come from two independent sources: fit, meaning how closely the person and company match the profile you sell to, and behaviour, meaning what that person actually did on your site and in your emails. The score decides order of contact, not whether someone is worth contacting.
03Can you give an example of lead scoring?
An operations director at a 180-person logistics company fills in a demo request after two pricing page visits. Fit: role 12, headcount band 10, industry 8, region 6 — 36 points. Behaviour: demo form 15, pricing page 12, three sessions 8 — 35 points. Total 71, comfortably over a threshold set at 62. A student downloading the same PDF scores 3 behaviour points and −15 for the title, landing on zero.
04How many leads do you need before lead scoring works?
Enough that the top and bottom buckets can be told apart statistically. Separating a 15% top bucket from a 5% bottom one at 95% confidence and 80% power needs 141 finished leads in each — roughly 420 across an even three-bucket model. If the real gap is closer to 5% against 10%, the requirement rises to 435 per bucket, about 1,300 in total.
05What is a good lead score threshold?
The one that passes through as many leads a week as your reps can genuinely work, and no more. Multiply reps by the number of new leads each can properly work in a month, divide by monthly scored volume, and take that share off the top of the score distribution. Three reps working 25 leads each against 400 scored leads a month means the top 19%, not a round 100 points.
06Should lead scores expire?
The behaviour half should, the fit half should not. A CTO at a company in your size band is still a CTO at that company six months later, but three pricing page visits from last quarter say nothing about this quarter's intent. Decaying behaviour by roughly ten points per thirty idle days keeps stale leads from sitting permanently at the top of the queue.
07What are the best lead scoring tools?
Scoring lives inside the tools you already run: marketing automation platforms such as HubSpot, Marketo, ActiveCampaign and Marketing Cloud Account Engagement, the product formerly called Pardot, all ship rule-based scoring on their paid tiers, and the larger CRMs including Salesforce and Zoho carry a predictive option. The deciding factor is where your lead data is already clean, because a model reading half-empty CRM fields scores noise no matter which vendor builds it.