Published
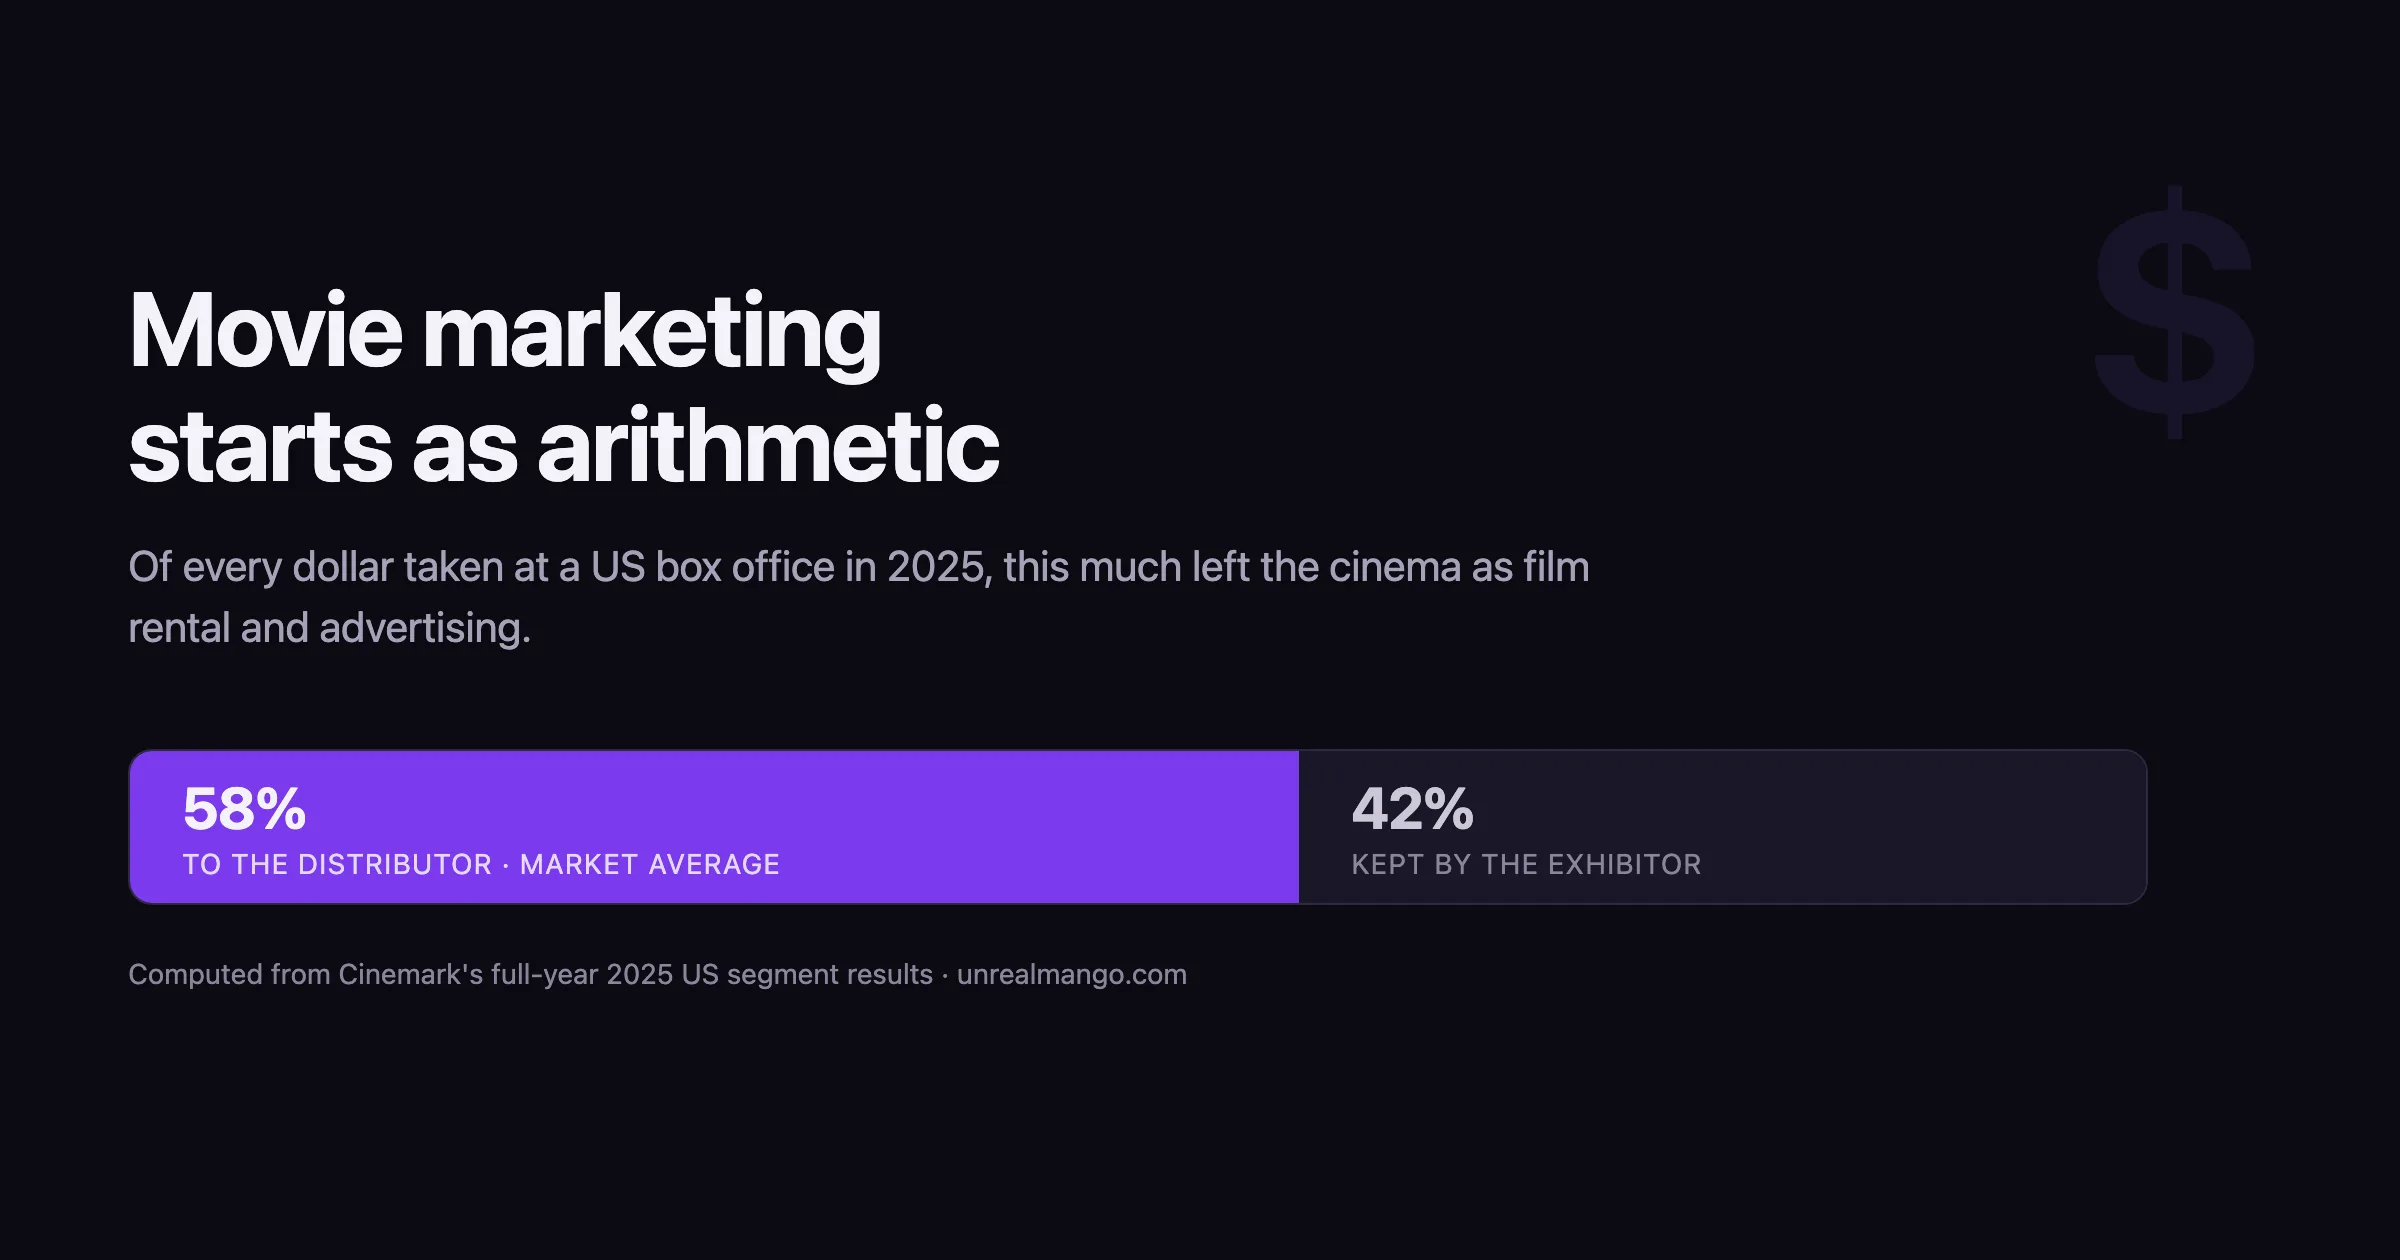
Movie marketing strategies are decided by two numbers before a trailer is cut: the share of the box-office dollar that returns to the distributor, and the size of prints and advertising against the production budget. In the US in 2025 the first averaged about 58 cents. The second routinely equals the whole negative.
How this was checked. The split figures below are computed from two line items in Cinemark’s and AMC’s filed full-year 2025 results, named at each claim; the Q4 results release does not print the percentage, so the arithmetic is ours and the inputs are theirs. Marketing figures are trade estimates, because the MPAA stopped publishing average advertising cost after the 2007 data year and nothing has replaced it. Window averages come from Omdia’s 2025 windowing study. Everything was read on 18 August 2026. For this query in the United States, Google returns an AI Overview and a top ten made almost entirely of tactic lists: seventeen strategies, seven best strategies, a PESO-model explainer, a definition page. Not one of them contains a break-even calculation.
What the exhibitors’ own filings say about your share of the ticket
Every article about marketing a film assumes a number it never states: how much of the box office you actually see. The folklore answer is a 50/50 split with the cinema. The audited answer is public, because exhibitors are listed companies and film rental is a line item on their income statement.
Cinemark’s full-year 2025 results, reported by segment, give the cleanest read available.
| Market | Admissions revenue | Film rentals and advertising | Share leaving the exhibitor |
|---|---|---|---|
| United States | $1,266.0M | $733.8M | 58.0% |
| International (Latin America) | $278.7M | $143.2M | 51.4% |
| Consolidated | $1,544.7M | $877.0M | 56.8% |
Two things follow immediately. The domestic distributor’s average share is about eight points better than the folklore, and the Latin American share is about seven points worse than the domestic one. A film whose gross is heavily international is not earning the same dollar as one that plays mostly at home, and no marketing plan that treats worldwide box office as one number can see that.
The 2024 comparison shows how stable this is rather than how volatile: $714.4 million against $1,233.1 million of US admissions, or 57.9%, within a tenth of a point of 2025.
Four qualifiers, because a number is only useful if it is honest. Cinemark’s line item is labelled “film rentals and advertising”, so it bundles a co-op advertising element with film rental proper, and the company does not break the two apart. The percentages are our division of two filed figures, not a disclosure. Film rental is gross to the distributor, not net to the producer: the distribution fee comes out of it before anyone upstream is paid. And Cinemark’s international segment is its Latin American circuit, so 51.4% says nothing about Europe or Asia, where terms differ and Chinese imports return far less to a foreign distributor.
AMC’s numbers show a different measurement of the same phenomenon. Its FY2025 10-K reports $1,275.2 million of film exhibition costs against $2,652.8 million of admissions revenue, or 48.1%, against 48.4% in 2024 and 48.0% in 2023. That is well below Cinemark’s consolidated 56.8%, and geography does not explain it: AMC’s international share of revenue is 23.6% against Cinemark’s 18.0% of admissions, worth well under a point on a blend. The residual is definitional — Cinemark’s line bundles advertising, AMC’s does not, and AMC discloses admissions revenue only in consolidation, so no US-only AMC figure can be computed. Treat the two as different instruments reading the same market, not as a like-for-like comparison.
AMC’s description of the mechanism is worth keeping in mind: “Film exhibition costs are based on a share of admissions revenues and are accrued based on estimates of the final settlement pursuant to our film licenses.” Cinemark is more specific about how the rate is set: “The majority of film rental rates are negotiated on a sliding scale formula, under which the rate is based on a standard rate matrix that is established with each content provider prior to a film’s theatrical run.” The published 58% is the output of that matrix applied across every title Cinemark played in 2025, from opening-weekend tentpoles at the top of the scale to late-run holdovers at the bottom. It is a market average, not a rate any single film is offered.
The P&A rule: marketing runs to roughly half the negative, and often all of it
The second number is harder to pin down, and the reason is structural. The MPAA used to publish average negative cost and average advertising cost per member film. It stopped. The last year it disclosed was 2007: $70.8 million to produce, $35.9 million to advertise, reported by Variety in 2008. Advertising alone was 50.7% of the negative; add prints back, which Follows’ analysis of MPAA data puts at around 10% of P&A at that point, and full P&A was roughly 56%. That is the last time anyone had to guess at nothing.
Everything since is trade estimate, which is why the range in the table below is so wide — and why most of the entries in it are hedged in their own sources.
| Benchmark | Figure, as the source words it | Source |
|---|---|---|
| Last MPAA-disclosed average, per member film | $70.8M production, $35.9M advertising — advertising at 51% of negative, P&A near 56% with prints added back | MPAA 2007 data, reported by Variety, 2008 |
| Global P&A, event film | “rarely fall under $150 million, and can spiral to twice that amount”, per several studio insiders | Variety, 2016 |
| Global marketing, biggest titles | “Don’t be surprised if studios set aside $150 million or more” — a prediction, not a report | The Hollywood Reporter, 2022 |
| Global marketing, second-tier summer title | “likely will have sizeable global marketing budgets of $75 million or more” | The Hollywood Reporter, 2022 |
| Advertising, independent wide release | “can start in the $20 million range”, to support an opening weekend | Variety, 2017 |
| Worked example | $250M production against a “conservatively estimated” $200M of marketing | Luminate on Black Panther: Wakanda Forever, 2024 |
Luminate’s summary of the rule is the plainest version in print: “The film’s P&A (aka Marketing) cost typically equals the cost of production.” Take that as the working assumption and the MPAA’s 56% as the floor, and you have a range rather than a number, which is the correct shape for a figure nobody discloses.
One historical detail changes what the acronym means. Prints have almost disappeared from prints and advertising. Follows’ analysis of MPAA member-company data puts prints at around 18% of the P&A budget in the early 1980s and around 10% by the late 2000s; digital projection has taken most of the rest. What is left is an advertising budget with a legacy name, and the largest single item in it for a wide release is still the video: the script that gets a spot to its point in thirty seconds is the asset the whole buy is amplifying.
It is also worth knowing how little of that spend is visible in the measured data everyone quotes. EDO put combined national TV advertising spending and media value for theatrical movies at $939.4 million across the whole category in 2024, down 24% year on year, and estimated Fantastic Four: First Steps at $16.9 million of US national TV as of mid-2025. Against the $150 million global marketing budget The Hollywood Reporter expected for a title of that scale, US linear television is on the order of a tenth of the money — and both ends of that ratio are estimates, not disclosures. Anyone benchmarking a campaign against measured TV spend alone is looking at a fraction of the budget.
The 2.5x break-even rule quietly assumes a 60% split above the market average
The most repeated number in film finance is that a movie must gross about two and a half times its production budget to break even. VideoAge International stated it in March 2026 as “box-office revenue to be about 2.5 times greater than a film’s production budget in order to break even”. It is a useful rule and it is more fragile than its confidence suggests.
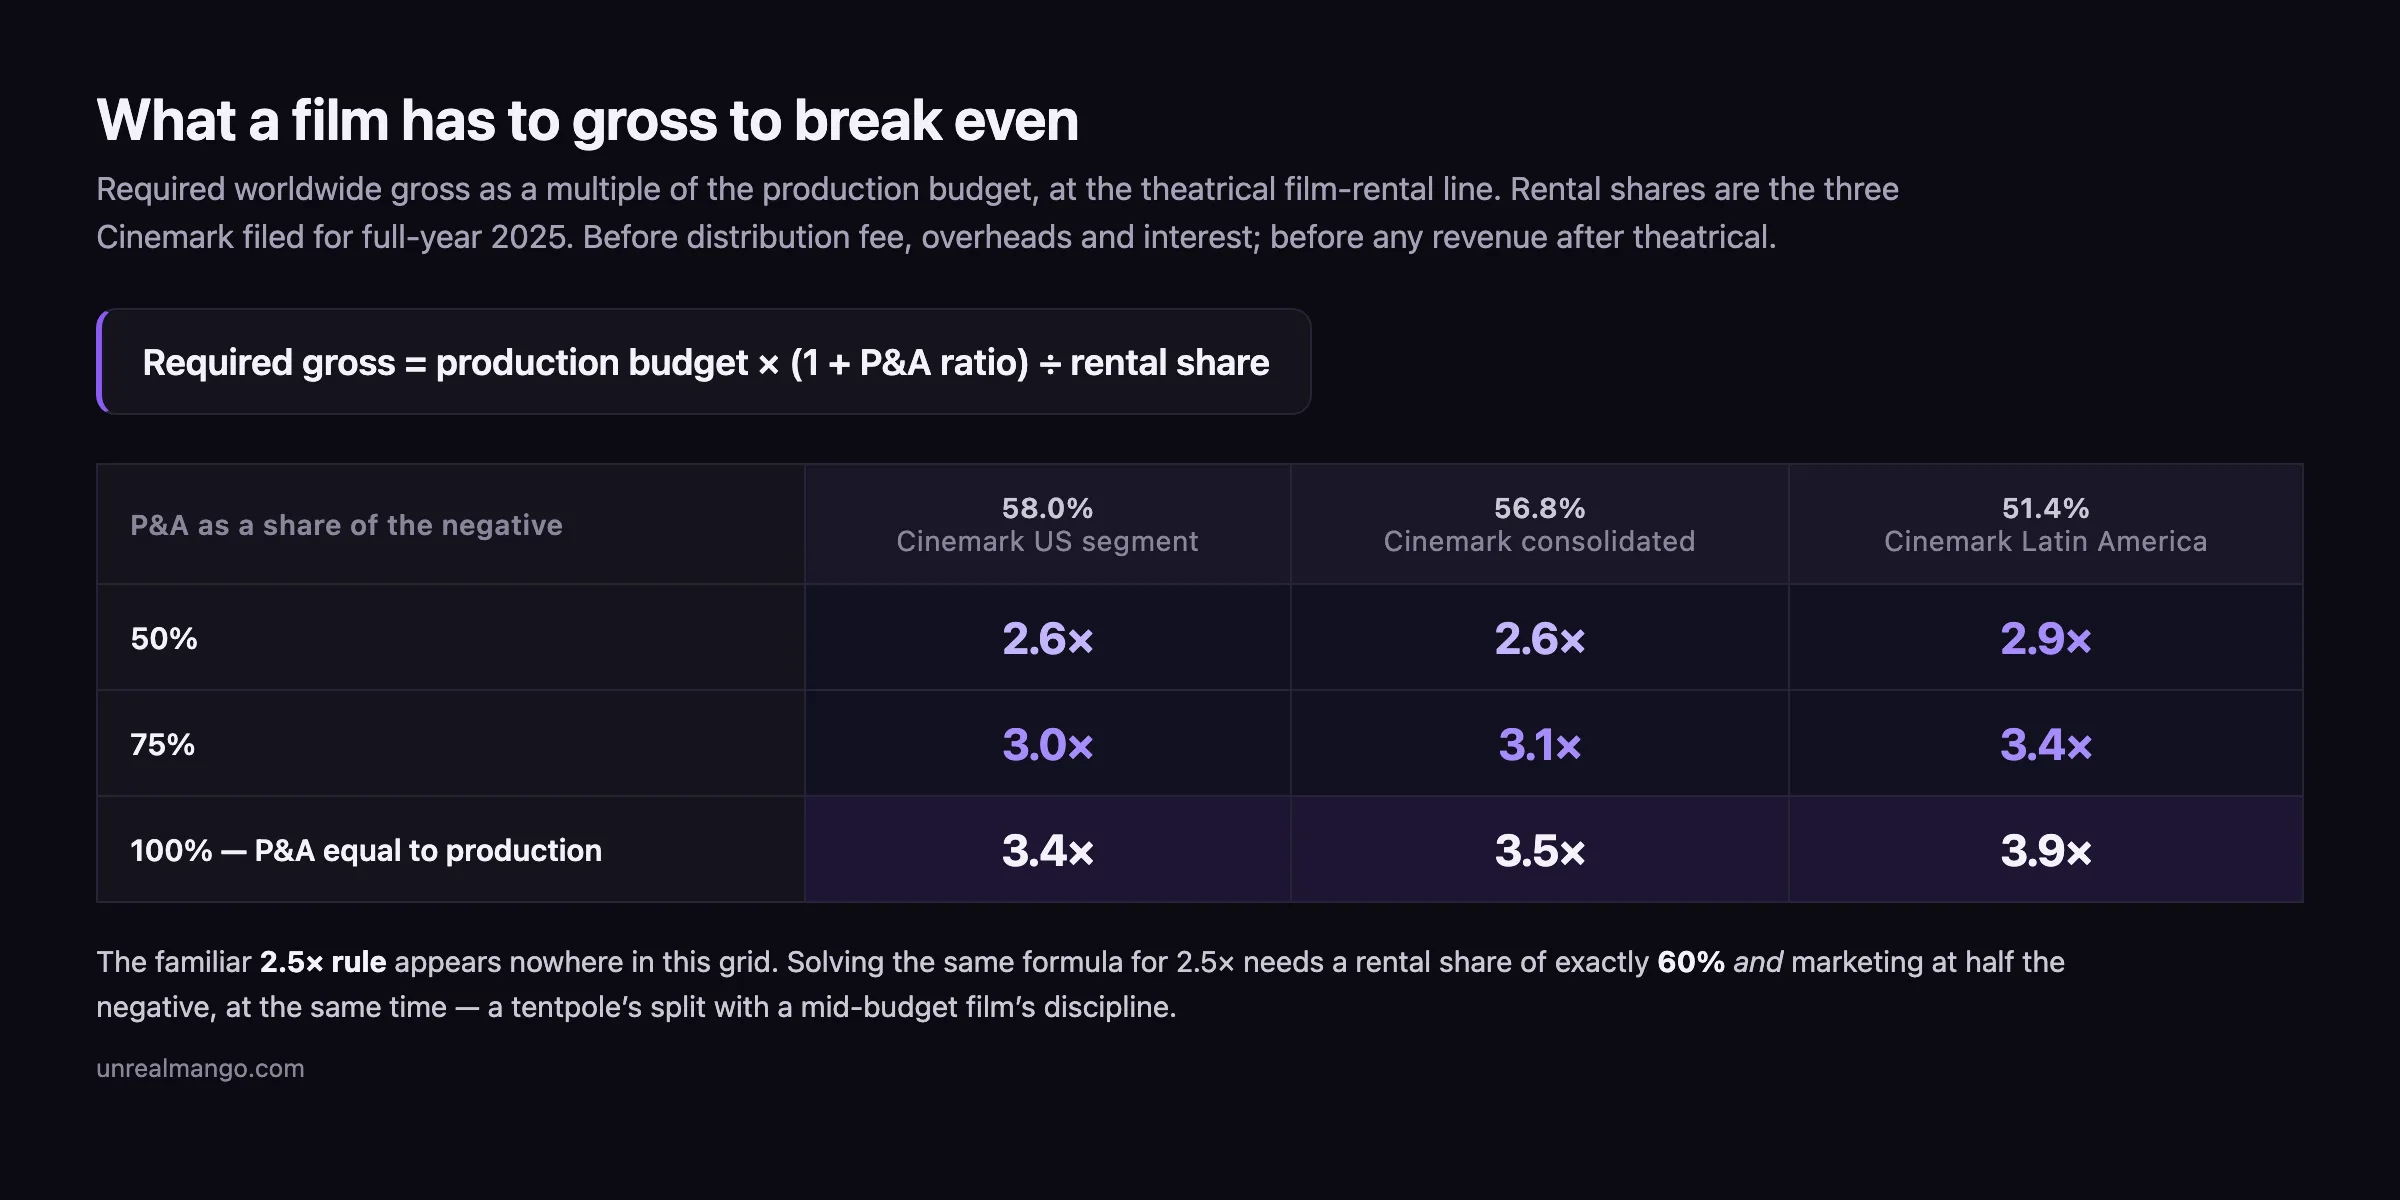
Write the arithmetic down and you can see exactly what it assumes. With a production budget of P, P&A at m times P, and a film rental share of r, theatrical break-even at the rental line arrives when:
Required gross = P × (1 + m) ÷ r
Set the required gross to 2.5P and solve, and r comes out at exactly 0.60 when m is 0.5. The 2.5x rule is not a general truth. It is the answer you get if the distributor keeps 60% of the box office and spends only half the negative on marketing, both at once.
Neither condition is impossible on its own. A tentpole on peak sliding-scale terms can clear 60% in its opening weeks, well above Cinemark’s market-wide 58%. Marketing at half the negative was the MPAA’s 2007 average. The problem is the pairing: the films that command the top of the rate matrix are the same films carrying the $150-million-plus campaigns, so the rule asks for a tentpole’s split with a mid-budget film’s discipline.
Here is the same formula run across the three rental shares Cinemark actually filed for 2025.
| P&A as a share of the negative | 58.0% — US segment | 56.8% — consolidated | 51.4% — Latin America |
|---|---|---|---|
| 50% | 2.6x | 2.6x | 2.9x |
| 75% | 3.0x | 3.1x | 3.4x |
| 100% — P&A equal to production | 3.4x | 3.5x | 3.9x |
Not one cell comes down to 2.5x. The friendliest corner of the grid, a US-heavy gross with marketing at half the negative, still needs 2.6x, and the case Luminate calls typical — P&A equal to production — needs 3.4x even on the best split filed.
The formula is not exotic; it is the arithmetic the trade already does implicitly. Variety reported in November 2022 that Black Adam, at $195 million to produce with a worldwide marketing spend industry sources put at $100 million — Warner Bros. said it had scaled the campaign back to $80 million — “needed to earn around $600 million worldwide to break even”, on the stated basis that “movie theater owners get to keep around half of those sales”. Run the formula at r = 0.50 and you get $590 million on the $100 million figure and $550 million on the studio’s own $80 million. This is not independent confirmation, because Variety used the same half-of-gross assumption; it is a demonstration that the method is the same one, and that the answer moves by $40 million on a marketing figure nobody discloses.
Two honest limits on the grid. It stops at the film rental line, so it ignores the distribution fee, overheads, interest, participations and tax credits, all of which make the picture worse. And it ignores every wave of revenue after theatrical, which makes the picture better. It is a theatrical break-even, not a profit statement, and it is the number a marketing budget has to clear on its own terms before anyone argues about the rest.
Stephen Follows tested the looser cousin of this rule — twice budget — against two datasets and found it “correctly identifies whether a movie made a profit or a loss 72% of the time with Nash movies and 75% of the time within the Insider movies”, across 2,819 and 279 films respectively. A rule that is wrong a quarter of the time is not useless. It is just not a plan.
The release window decides how many waves of revenue you market into
There is a frame for this that has already been worked out next door. In games, the launch calendar is handed to you by the platform rather than chosen, and every marketing decision fits between fixed gates. Film has the same structure with a different clock, and the clock is the release window. What follows is the economics, not the calendar mechanics.
Before 2020 the window was a convention: roughly 90 days of theatrical exclusivity before a digital release. It broke in public. Universal and AMC announced terms on 28 July 2020 giving a minimum of three weekends, seventeen days, before Universal could take a title to premium video on demand. AMC chief executive Adam Aron justified the length on the grounds that “a considerable majority of a movie’s theatrical box office revenue typically is generated” in that span — a claim from a party to the deal, not an independent measurement. Universal’s November 2020 agreement with Cinemark added the tier that still governs the shape of the market: titles opening to $50 million or more get 31 days and at least five full weekends, everything else gets 17 days and three.
What actually happened since is measurable. Omdia’s study “US Movies: Theatrical, TVOD, SVOD, and Other Windowing Strategies 2025”, published April 2026, found the average first transactional window for wide releases at 39 days in 2025, up from 36 in 2024. The top ten North American films averaged 51 days, up from 45. Disney ran longest at 61.6 days. The average subscription window was a provisional 95 days, down from 98.
| Stage | Pre-2020 convention | 2020 negotiated floor | 2025 measured average |
|---|---|---|---|
| Theatrical to first transactional release | ~90 days | 17 days, or 31 days for $50M+ openers | 39 days for wide releases, 51 for the top ten |
| Theatrical to subscription streaming | months, unstandardised | not covered by the 2020 deals | 95 days, provisional |
Read the third column against the second. The negotiated floor is 17 days. The actual average is 39. Studios bargained for the right to collapse the window and then, on average, chose not to use most of it.
Windows are lengthening again while the PVOD case for shortening them weakens
The reversal is now explicit. On 13 March 2026 Universal committed to a 31-day minimum for all its 2026 Universal Pictures releases, beginning with Reminders of Him, and a 45-day minimum from 2027. Focus Features stays at 17 days, and Christopher Nolan’s films are negotiated separately at around 100. Donna Langley framed it as “Universal remains a theatrical-first studio”; Cinema United’s Michael O’Leary called it “a positive and welcome step by Universal”. The studio that broke the 90-day window in 2020 has spent 2026 rebuilding half of it.
The reason the short window looked attractive was margin, and the margin is real. IndieWire put the studio’s VOD revenue share at “nearly 80 percent; with theaters, it’s close to 50/50”. Against Cinemark’s measured 58% rather than the folklore 50%, that still makes a digital dollar worth about 1.4 gross dollars of domestic box office to the distributor. Trolls World Tour is the case everyone cites: CNBC reported nearly $100 million in digital rentals in three weeks from its April 2020 release, of which Universal retained about 80%, against the $153.7 million of domestic theatrical the original Trolls collected, of which it retained roughly half. Similar money to the studio either way, earned in three weeks instead of five months.
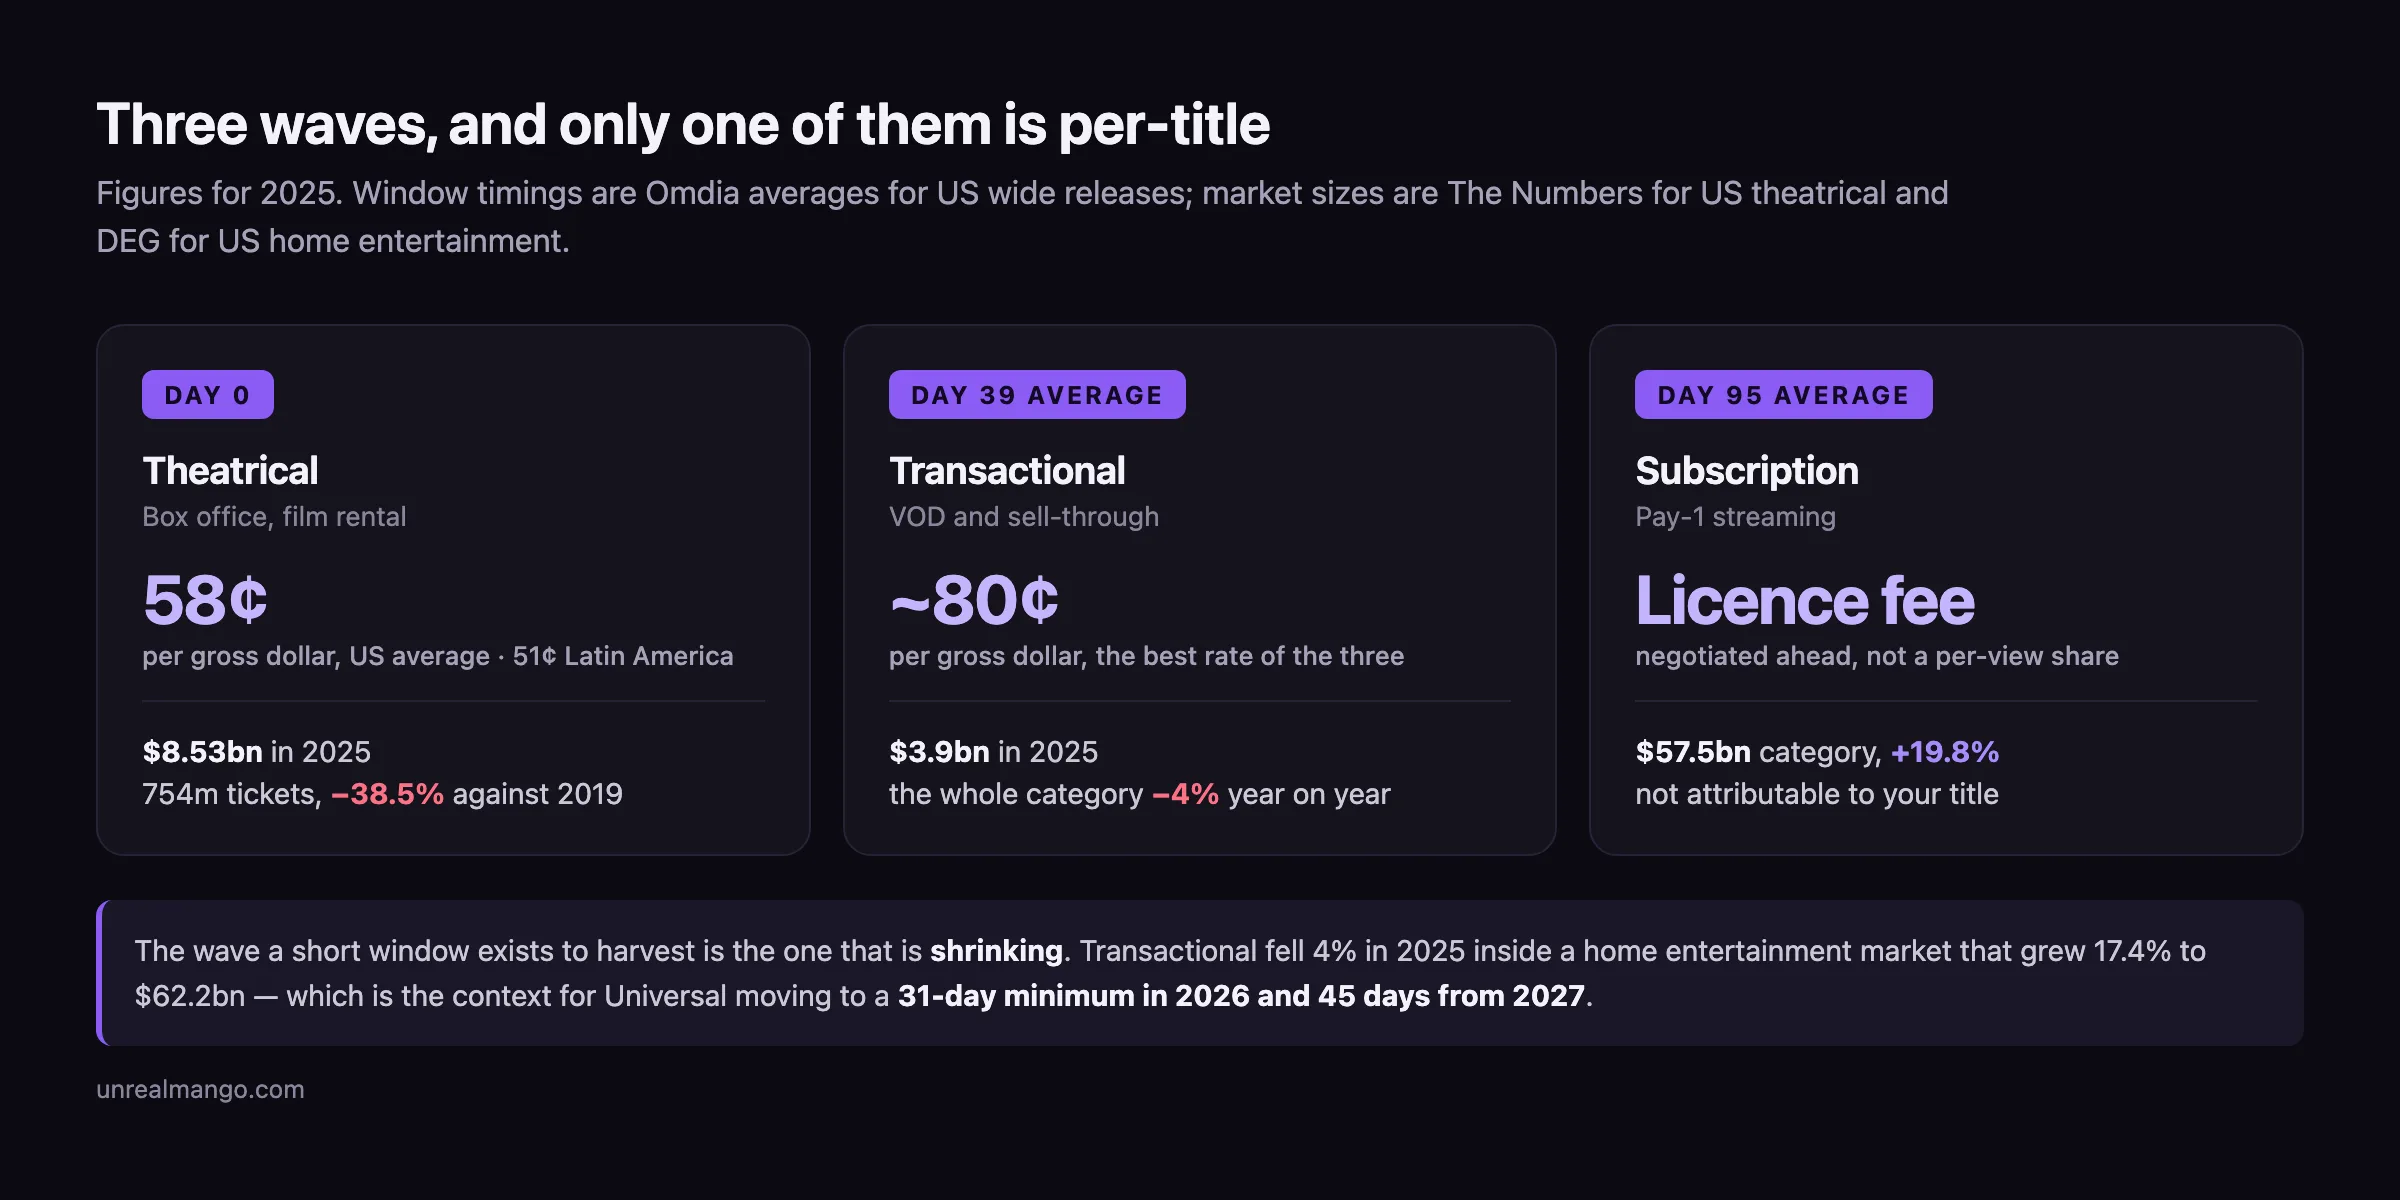
What has changed is the size of the pool that margin applies to. DEG’s year-end 2025 report puts US consumer spending on home entertainment at $62.2 billion, up 17.4%. Almost all of that growth is subscription: $57.5 billion, up 19.8%, more than 92% of the total, with ad-supported tiers up 60.9% to $10.3 billion. Digital transactional — all VOD and electronic sell-through, the business a short window is supposed to feed — was $3.9 billion and fell 4%, with sell-through down 3.3% and rentals down 4.7%.
That is the finding a tactic list will not give you. The category the short window exists to harvest is shrinking, in a home entertainment market growing at 17%, and it is shrinking while windows are at their shortest in history. The 2026 move back toward 31 and 45 days is not nostalgia. It is a reallocation toward the wave that still scales.
| Wave | Typical opening in 2025 | What the distributor keeps per gross dollar | US market size, 2025 |
|---|---|---|---|
| Theatrical | day 0 | ~58 cents domestic average, ~51 cents Latin America | $8.53B (The Numbers) |
| Transactional: VOD and sell-through | day 39 average | ~80 cents | $3.9B, down 4% (DEG) |
| Subscription, Pay-1 | day 95 average | a licence fee, not a per-view share | $57.5B category, not per-title attributable (DEG) |
The third row carries the caveat that matters most. A $57.5 billion subscription market is not $57.5 billion of addressable revenue for your film, because subscription money is paid to a service rather than to a title. Netflix’s global Pay-1 agreement for Sony’s features, reported in January 2026 with a rollout beginning later in 2026 as rights free up by territory and full global coverage by early 2029, is a licence negotiated in advance, not a share of viewing. Marketing into that wave grows a platform’s retention, and your leverage on it is contractual rather than promotional.
One more number belongs in any audience assumption, with its method attached. Using The Numbers for both sides, the US market took $8.53 billion in 2025 against $11.23 billion in 2019, down 24.0%. Deflated by the MPA average ticket prices The Numbers uses to derive its ticket counts — so this is the same money restated, not an independent headcount, and the current year is annualised — that is 754.1 million admissions against 1,225.6 million, down 38.5%. There is no true national admissions count published in the US, but on the best available restatement, price inflation is carrying more than a third of the apparent stability in dollars. The trackers also disagree on the top line: Box Office Mojo has 2025 domestic at $8.66 billion and Gower Street Analytics at $8.87 billion, so pick one source and stay in it rather than mixing.
What changes when a film goes straight to a platform
Everything above stops applying, and most of the planning stops with it.
A streaming-first film has no film rental line, no exhibitor split, no break-even multiple, and no second or third wave. It is bought, not released. The mechanism is cost-plus: the platform pays the production budget plus a premium and takes the rights. The size of that premium is reported inconsistently and you should treat the range as the answer rather than picking a point in it. Netflix co-CEO Ted Sarandos has described the premium as 10 to 20% or higher across series and films, with the platform buying out syndication and international rights instead of sharing a back end, and said plainly: “We think we have the right model and we are not looking to change it.” CNBC reported in 2018 that “most standard deals get about 30 percent on top of production costs” — a benchmark for original series rather than features, and the closest public marker for the upper end.
The consequence for marketing is a change of objective, not of budget line. Theatrical marketing buys an opening weekend against a fixed date, because the window is short and the exhibitor deal is written on the assumption that the early weekends carry the gross. Platform marketing is bought against a viewer who is already inside the service, and the metric is whether they start and finish rather than whether they leave the house. The wide national buy that a theatrical campaign is built around has no equivalent job to do.
How much a streamer spends promoting its own film is not public. We looked, and there is no credible figure to quote — no filing, no trade tally, no equivalent of the P&A estimates above. That absence is itself worth knowing, because it means any comparison of streaming-first and theatrical marketing budgets you read is being asserted rather than measured.
What does survive intact is the earned side of the campaign, which costs the same in either model and is the part most likely to be underbuilt: the launch announcement, and the critics and outlets who decide whether anyone writes about the film at all. The mechanics of an announcement that a newsroom can actually run and a pitch a journalist will open do not change because the release is on a platform.
Movie marketing strategies in the order the money decides them
Working from the budget backwards, the sequence that keeps a campaign honest looks like this.
- Fix the rental share you expect to receive before anything else. Cinemark’s US and Latin American segments differ by nearly seven points, and that difference moves the break-even multiple by 0.3x to 0.5x depending on where P&A lands.
- Set P&A as a ratio of the negative, not as an absolute. The defensible range runs from about 56% at the low end, the last MPAA-disclosed average with prints added back, to 100%, which Luminate calls typical.
- Compute the required gross before approving the campaign, not after. Required gross = production budget × (1 + P&A ratio) ÷ rental share. If the answer is above 3x, the marketing plan is not the variable that will fix it.
- Decide the window as an economic choice, not a default. The 17-day floor still exists, but the industry average is 39 days and Universal is moving to 45 by 2027.
- Do not model growth into the transactional wave. It fell 4% in 2025 while home entertainment overall grew 17%.
- Budget the third wave as a licence, not a campaign. Pay-1 revenue is negotiated years ahead; promotion does not move it.
- If the film is going straight to a platform, stop modelling waves and model the premium. There is one payment — 10 to 20% or higher over the negative on Sarandos’s account, with about 30% reported for series — and no back end.
- Deflate receipts before you read them. Dollars are down 24.0% against 2019 and the same money restated in tickets is down 38.5%; the headline figure will tell you the audience is healthier than it is.
The arithmetic is the part you can get right on the first attempt, which is worth doing, because the two things it cannot decide are the ones that actually determine the outcome. A campaign priced correctly against a film nobody wants to see still returns 58 cents on a dollar that never arrives. And a trailer that works is worth more than any split you can negotiate.
If you are building the assets that campaign is going to spend against, our work with entertainment and media clients starts from the same place this article does: what the release has to earn back, and by when.
08 / Reader questions
Frequently asked questions
01What is the 2.5 rule for movies?
It is the rule of thumb that a film has to gross about 2.5 times its production budget to break even. Solve the arithmetic and it only works if the distributor keeps 60% of the box office while spending half the negative on marketing. Cinemark's 2025 US segment returned 58% market-wide, and the films most likely to beat that are the same films whose marketing equals their negative.
02How much does it cost to market a movie?
For a global tentpole, The Hollywood Reporter expected studios to set aside $150 million or more in 2022; Variety reported studio insiders putting event-film P&A rarely under $150 million as far back as 2016. An independent wide release opening-weekend campaign can start around $20 million. The last figure the MPAA ever disclosed, for 2007, was $35.9 million of advertising per member film.
03What percentage of box office does the studio get?
About 58% in the United States, from Cinemark's audited full-year 2025 figures: $733.8 million of film rentals and advertising against $1,266.0 million of US admissions revenue. Its Latin American circuit returned 51.4%. The familiar 50/50 split understates the domestic distributor's average share by roughly eight points.
04Is marketing included in a movie's budget?
No. The quoted production budget is the negative cost, which stops at the finished film. Prints and advertising is a separate line, and Luminate calls P&A equal to the cost of production typical. On its conservative estimate, a film reported as costing $250 million to make carried another $200 million in P&A.
05How long is the theatrical window in 2026?
Universal committed to a 31-day minimum for its 2026 Universal Pictures releases and 45 days from 2027, announced 13 March 2026; Focus Features stays at 17 days. Measured across the industry in 2025, wide releases averaged 39 days to the first transactional release and a provisional 95 days to subscription streaming, per Omdia.
06What is PVOD and how much does it cost?
Premium video on demand is the paid digital release that follows the theatrical window, conventionally $19.99 for a 48-hour rental and occasionally higher. It matters to studios because IndieWire puts their VOD revenue share at nearly 80%, against the 58 cents on the dollar a domestic ticket returned in 2025.
07How much do streaming platforms pay for a film?
On a cost-plus basis rather than a share of revenue. Netflix co-CEO Ted Sarandos has described the premium over budget as 10 to 20% or higher for series and films; CNBC reported about 30% in 2018, but for original series rather than features. In exchange the platform buys out syndication and international rights, so there is no back end.