Published
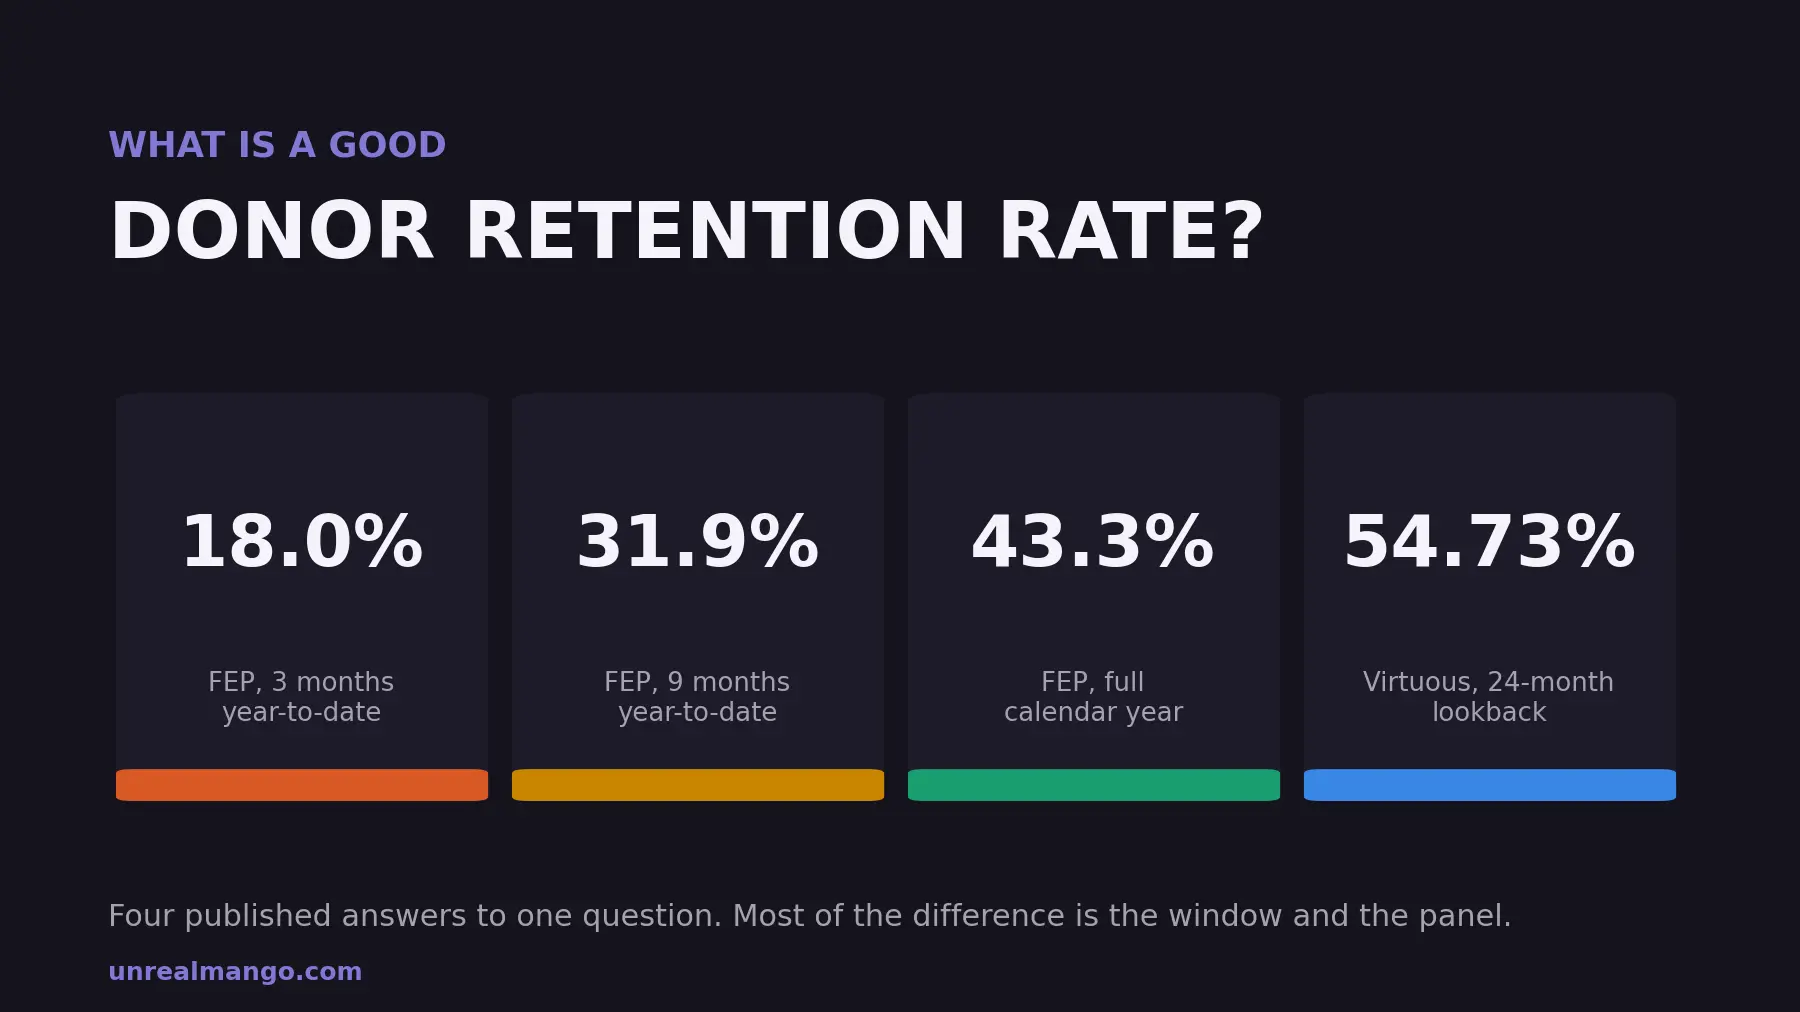
A good donor retention rate is about 43% measured across a full year, and roughly 55% if you allow donors two years to come back. Both numbers describe the same sector. The Fundraising Effectiveness Project reported 43.3% for 2025; Virtuous reported 54.73% on a 24-month lookback. The gap is mostly the window, not the fundraising.
How this was checked. In August 2026 we read every page Google returned in the United States for “what is a good donor retention rate” and recorded three things from each: the number it gives, the source behind that number, and the period that source measures. Figures below come from the Fundraising Effectiveness Project, the 2026 Virtuous Nonprofit Benchmark Report (771 mid-sized US nonprofits), Dataro’s 2024 Donor Retention Analysis and the Association of Fundraising Professionals. Every figure below carries its window, or is marked as having none — because on this metric the window does most of the work, and roughly half the published benchmarks do not state one.
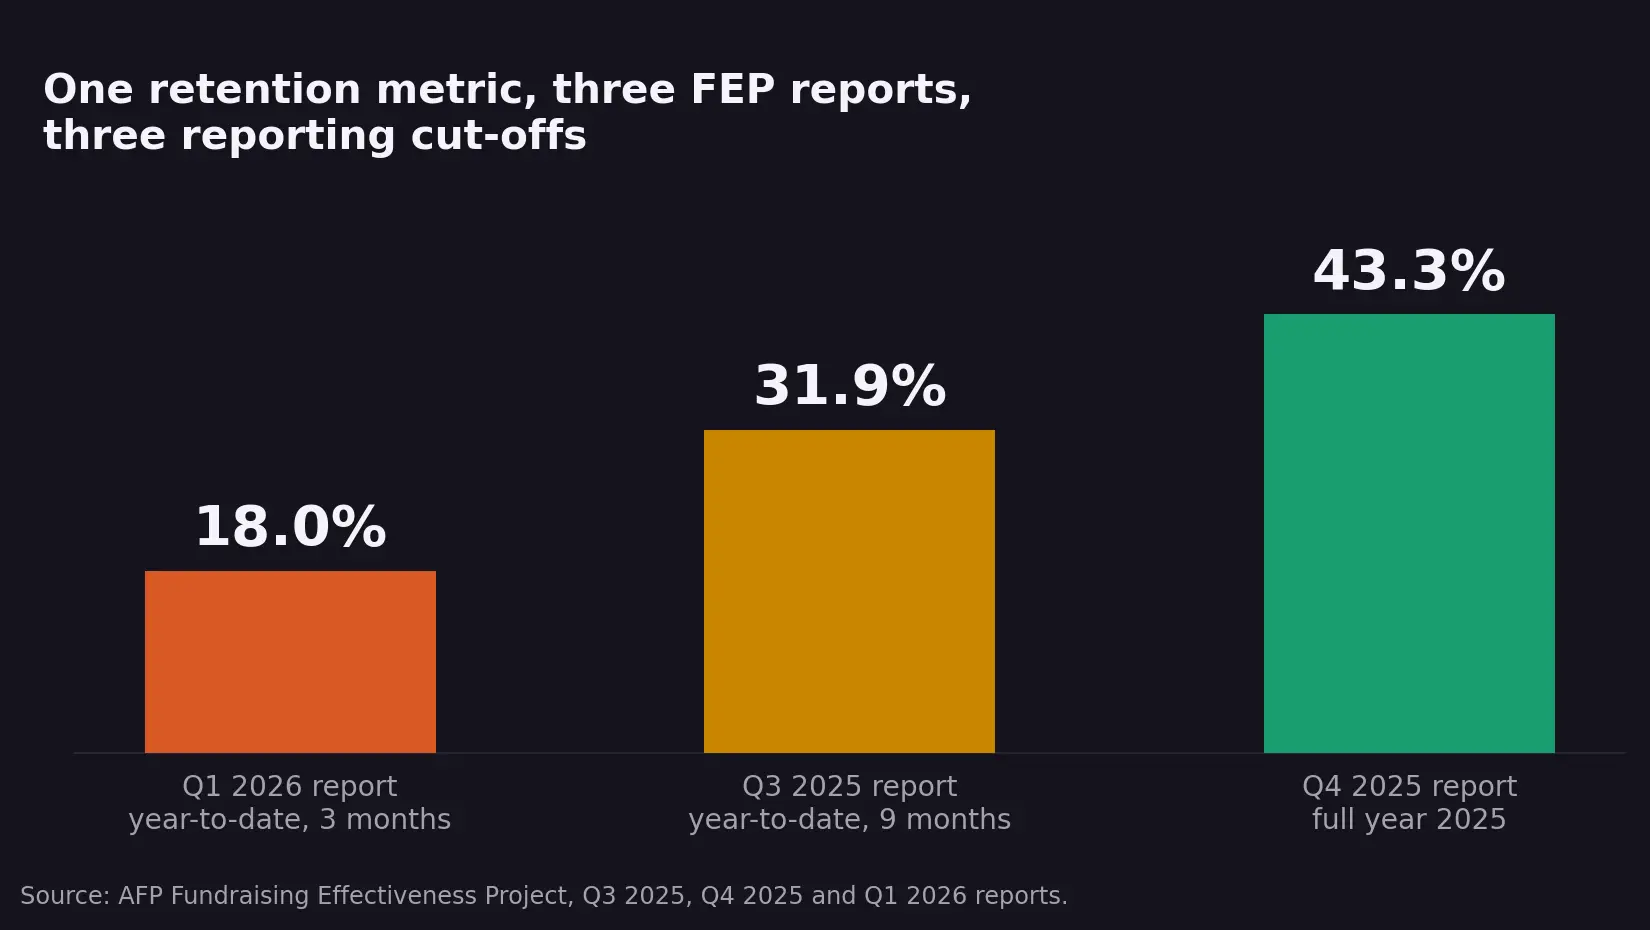
One metric, three FEP reports: 18.0%, 31.9% and 43.3%
The Fundraising Effectiveness Project is the closest thing the US sector has to a census of giving, and it publishes retention every quarter. Three of its recent readings:
| FEP report | Rate | What it counts |
|---|---|---|
| Q1 2026 | 18.0% | prior-year donors who had given again by 31 March |
| Q3 2025 | 31.9% | prior-year donors who had given again by 30 September |
| Q4 2025, full year | 43.3% | prior-year donors who gave again at any point in 2025 |
Read down that column and it looks like a collapse and a recovery. It is neither. Each figure is a year-to-date count with a different amount of the year inside it, and December is when a large share of individual giving lands. A three-month reading is a partial count wearing the same label as an annual one.
One honest caveat about that first row: it measures a later cohort than the other two, the 2026 file at the end of March rather than the 2025 file. FEP reports it as unchanged year over year, so the 2025 file stood in much the same place at its own three-month mark. What the column shows is the shape of the giving year, not a trend.
This matters beyond trivia, because secondary sources quote whichever figure they found. Bloomerang has published 46% in one article and 31.9% in another, both correctly attributed to FEP, because the two came from different reports. If your board deck cites one and your consultant cites the other, you are not disagreeing about performance.
FEP’s panel is worth knowing, with one caveat of its own: the screening rules below were introduced with the Q1 2026 report, so the two earlier readings rest on a slightly different panel. Q1 2026 covers 15,700 US organisations, 3.2 million donors and $3.5 billion in giving, drawn from donor-management and online-fundraising platforms, screened for 24 months of consistent reporting, with organisations above $25 million excluded so the very large do not swamp the average, and weighted by cause area against 2023 IRS Form 990 filings.
Where every other published benchmark gets its number
Here is every ranking page’s answer, with the window its own source states — not the window a reader might assume.
| Source | Rate published | Window stated by the source | Panel stated |
|---|---|---|---|
| FEP, Q1 2026 report | 18.0% | year-to-date, 3 months | 15,700 orgs, 3.2M donors |
| Bonterra, citing Fundraising Report Card | ~34% | not stated | not stated |
| DonorSearch, citing Fundraising Report Card | just under 35% | not stated | not stated |
| NextAfter, citing FEP | 40-45% | not stated | not stated |
| The Donor Relations Group, citing AFP | 40-50% | not stated | not stated |
| FEP, Q4 2025 report | 43.3% | full year 2025 | not published |
| Bloomerang, citing FEP | 46% | not stated | not stated |
| CCS Fundraising | 46% | average across the last five years | CCS’s own client base |
| Virtuous 2026 benchmark | 54.73% | 24-month lookback | 771 mid-sized US nonprofits |
| Virtuous, top quartile | 69.64% | 24-month lookback | same 771 |
Four of those ten rows carry a window the source actually states. That is the finding rather than a footnote: most published donor retention benchmarks cannot be compared with your own number, because they never say what they measured.
Where the window is stated, the pattern is clean. Three months of a year gives 18%. A full year gives 43%. Twenty-four months gives 55%. Virtuous is explicit that it tightened its lookback from 25 months to 24 for the 2026 edition — exactly the kind of definitional change that moves a headline number while nothing happens in the real world.
Panel does the rest of the work. Virtuous reads 771 mid-sized nonprofits. FEP reads 15,700 organisations, all under $25 million. CCS reports on the organisations it consults for, averaged over five years. Three populations, three questions, three numbers, none of them wrong.
This is the same failure that makes email benchmarks unreliable, where the reported figure moved because the measurement changed rather than because behaviour did — we worked through that case in detail in our piece on what counts as a good email open rate. The discipline transfers: sort divergent sources by method and date before you average anything.
How to calculate donor retention rate, and where the definition leaks
The arithmetic is one line.
Donor retention rate = (donors from the prior period who gave again in the current period ÷ total donors in the prior period) × 100
If 300 people gave in 2025 and 159 of them gave again in 2026, retention is 53%. Note what the denominator is: everyone who gave last period, not everyone in your database, and not everyone you mailed.
Four decisions sit inside that one line, and each of them moves the answer:
- The window. Calendar year, fiscal year, rolling twelve months or a two-year lookback. This is the largest single lever, as the table above shows.
- What counts as a donor. Individuals only, or households, or organisations too? A household counted as two donors one year and one the next produces churn that never happened.
- What counts as a gift. Event ticket revenue, membership dues, and donor-advised fund grants each get treated differently by different organisations, and each decision changes both numerator and denominator.
- When the data is cut. A gift posted in January for a December pledge lands in the wrong year unless you apply the same reporting lag to both years being compared. FEP does this explicitly, applying an equal reporting window to both sides of every comparison.
None of this is exotic. It is the same problem as choosing a denominator for an engagement rate calculation: the formula is agreed, the inputs are not, and the number is meaningless until you say which inputs you used.
First-year and repeat donors are two metrics wearing one name
The single most useful split in fundraising measurement is between people giving for the first time and people who have given before. They behave differently enough that the blended figure describes neither group well.
FEP’s Q3 2025 report, all three figures year-to-date at nine months:
| Segment | Retention |
|---|---|
| New donors | 14.0% |
| Repeat donors | 43.6% |
| All donors | 31.9% |
Bloomerang publishes a different FEP-derived set — 23% for first-time donors, 60% for repeat donors and 46% overall — without stating a window. Bonterra, quoting a year-to-date FEP cut, gives 18.9% and 59.3%. Treat each set as a package rather than mixing components from one with the headline from another. What survives across all three: repeat donors retain at roughly three times the rate of first-time donors.
It gets sharper if you cut by how many gifts a donor has already made. FEP’s Q3 2025 figures, again year-to-date:
| Prior gifts | Retention |
|---|---|
| One-time donors | 19.2% |
| Two-time donors | 38.5% |
| Three to six gifts | 62.5% |
| Seven or more gifts | 87.3% |
The second gift roughly doubles the odds of a third. Dataro’s 2024 analysis puts the same effect from the other side: about 69% of first-time donors never give again, but 59% of those who make a second gift keep going.
A good acquisition year pushes your overall retention rate down
Here is the consequence none of the pages ranking for this question draws out. Your overall retention rate is a weighted average of two very different rates, and the weight is the share of your file that gave for the first time. Improve acquisition and that share rises, which drags the blended number down even though neither component changed.
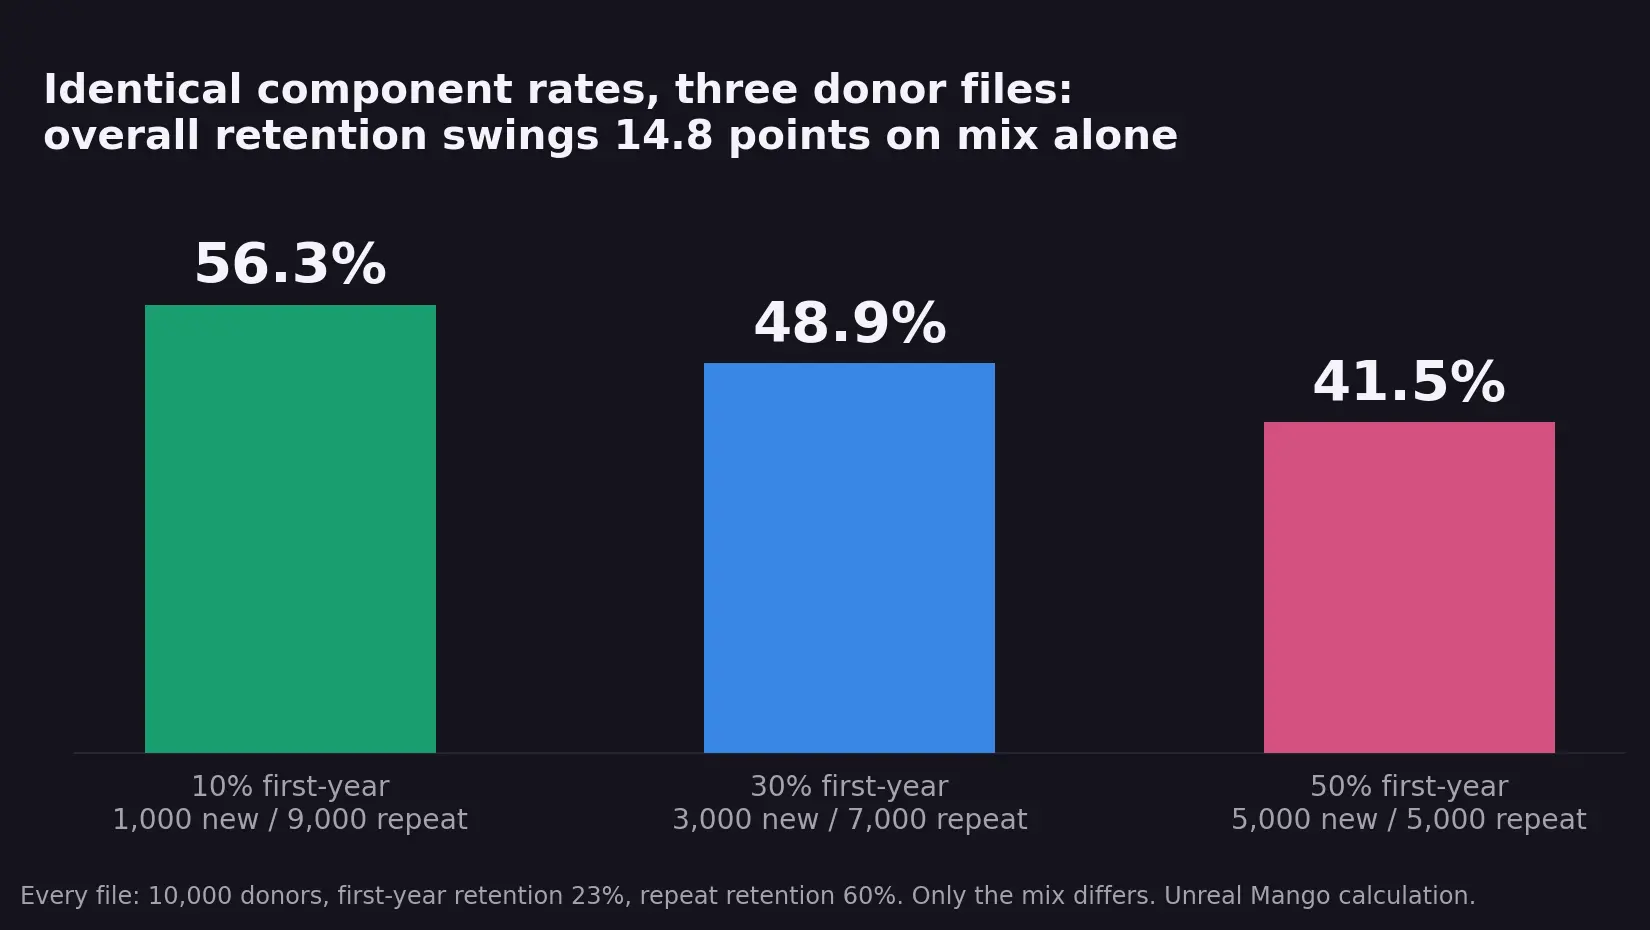
Take three organisations with an identical 10,000-donor file and identical component rates, using Bloomerang’s 23% and 60% as illustrative inputs. The only difference is the mix.
| First-year share of file | First-year retained | Repeat retained | Overall rate |
|---|---|---|---|
| 10% (1,000 / 9,000) | 230 | 5,400 | 56.3% |
| 30% (3,000 / 7,000) | 690 | 4,200 | 48.9% |
| 50% (5,000 / 5,000) | 1,150 | 3,000 | 41.5% |
Fourteen point eight points of spread, and not one donor behaved differently. That is wider than the entire 40-50% band the annual benchmarks sit in. The organisation at the top of this table is not better at keeping donors; it is worse at finding them.
Two practical rules follow. First, never celebrate a rising overall retention rate without checking whether new-donor volume fell — the sector-wide picture in 2025 was exactly that shape, with dollars up an estimated 5.0% while donor counts fell 3.6%. Second, set targets on the components, not the blend. “Lift first-year retention from 21% to 26%” is a goal a team can act on. “Lift overall retention to 50%” can be achieved by cancelling your acquisition programme.
Donor retention benchmarks worth comparing yourself against
Compare like with like: find the row that matches what you are measuring, and check the window before you draw a conclusion.
| What you are measuring | Benchmark | Window | Source |
|---|---|---|---|
| All donors | 43.3% | full year 2025 | FEP |
| All donors | 54.73% | 24-month lookback | Virtuous 2026 |
| All donors, top quartile | 69.64% | 24-month lookback | Virtuous 2026 |
| First-time donors | 23% | not stated | Bloomerang, from FEP |
| Repeat donors | 60% | not stated | Bloomerang, from FEP |
| Monthly recurring donors | 90% | not stated | Bloomerang |
| New donors | 14.0% | year-to-date, 9 months | FEP Q3 2025 |
| Repeat donors | 43.6% | year-to-date, 9 months | FEP Q3 2025 |
| Reactivated donors | 40.4% | 2023 | Dataro |
| Lapsed donors reactivated | 9.8% | per year | Dataro |
| First-to-second gift conversion | 25.84% (37.86% top quartile) | 24-month lookback | Virtuous 2026 |
| Days between first and second gift | 108.5 (68 top quartile) | 24-month lookback | Virtuous 2026 |
| Gifts per donor per year | 4.15 (6.62 top quartile) | annual | Virtuous 2026 |
The monthly recurring row is the one to look at twice. Roughly 90% against roughly 23% for a one-off first-time donor is a four-fold difference, and it is available to any organisation that puts a recurring option in front of a first-time donor at the moment they give. It is also the cleanest argument for spending on the giving experience rather than on another acquisition push.
What one retention point costs you at acquisition prices
Retention arguments usually stop at “it is cheaper to keep a donor than to find one”. Here is the arithmetic, using the most widely cited published cost figures that carry an organisation’s name.
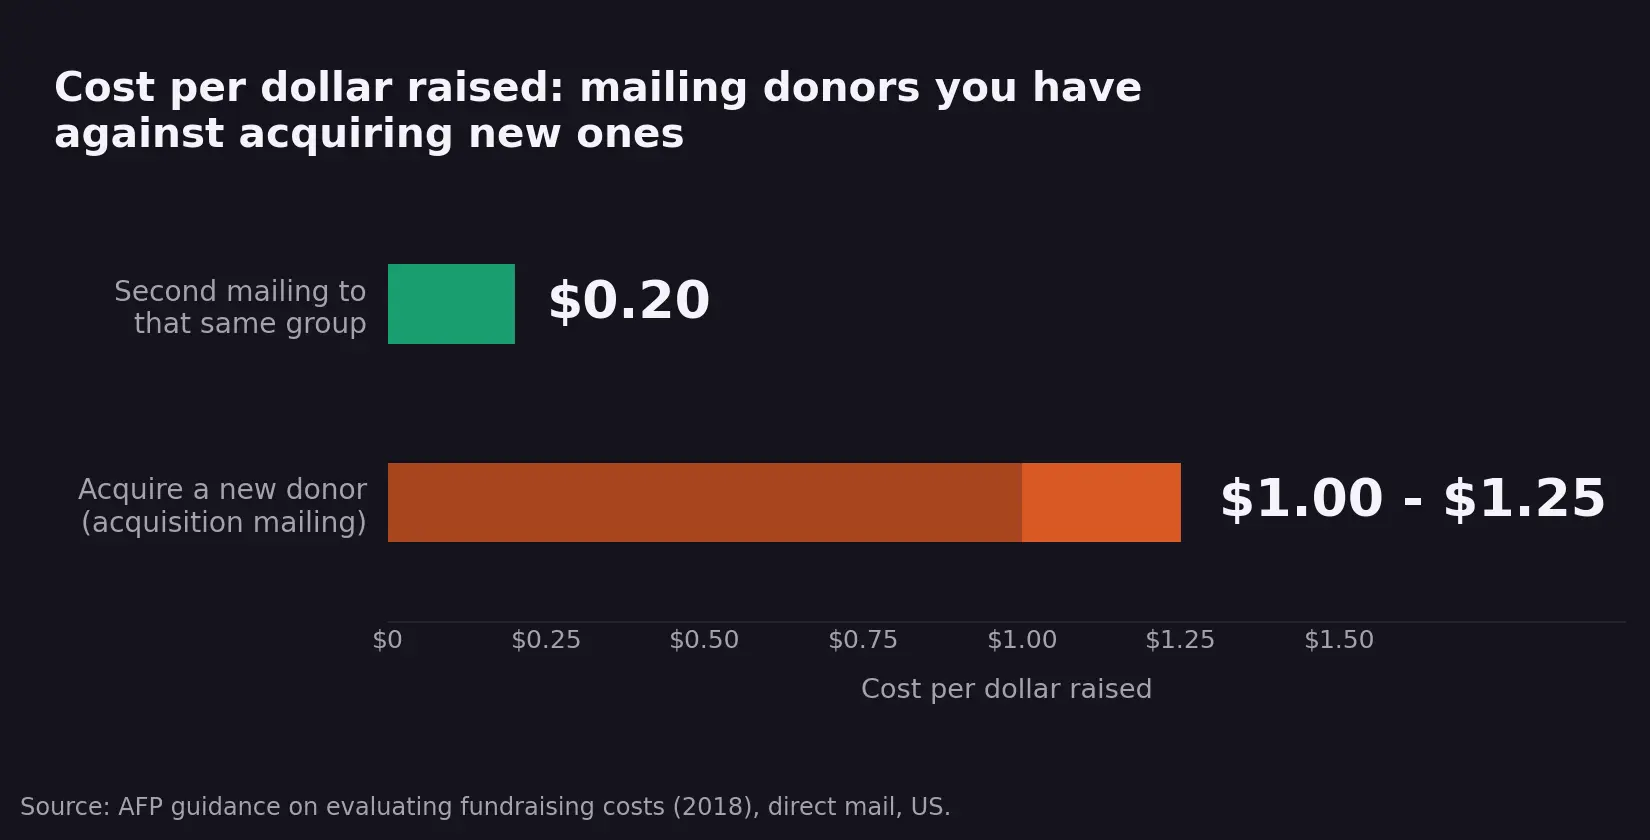
AFP’s guidance on evaluating fundraising costs puts direct mail acquisition at $1.00 to $1.25 per dollar raised, and a second mailing to that same newly acquired group at about $0.20 per dollar raised. Acquisition runs at a first-year loss by design; mailing the people you just recruited runs at roughly a five-fold return.
Now price a single retention point on a 10,000-donor file with a $100 average gift. One point is 100 donors, which is $10,000 of gift income.
| Cost to raise that $10,000 | |
|---|---|
| Mail the 100 donors you already have | ~$2,000 |
| Replace them through acquisition | $10,000-12,500 |
| Difference, per point, per year | $8,000-10,500 |
Three honest caveats. AFP’s figures are guidance for direct mail in the US, published in 2018 without an underlying study attached, so treat the ratio as the durable part and the cents as an illustration. The $0.20 describes re-soliciting a cohort you have just acquired; renewing a long-established file has its own economics. And the calculation above covers year one only — the real gap compounds, because the donor you kept can be mailed again next year at renewal prices while the replacement has to be acquired first.
That compounding is also why free and low-cost acquisition channels are worth the setup effort even when they convert modestly. A Google Ad Grant that brings in first-time donors at close to zero media cost changes the arithmetic at the acquisition end, and it does nothing at all about the roughly three-quarters of first-time donors who never give a second time — which is where the money actually leaks.
The four numbers to put in front of your board
Overall retention on its own invites the wrong conversation. Four numbers, each labelled with its window, describe the file honestly and point at different work:
- First-year donor retention. The hardest number to move and the one that compounds most. Target the second gift, not the second year: Virtuous puts the average gap between first and second gift at 108.5 days, and at 68 days for the top quartile.
- Repeat donor retention. Your baseline loyalty. If this slips, something in stewardship broke; it should be the most stable number on the page.
- Recurring-gift share of donors. The lever with the largest published effect, given roughly 90% retention among monthly donors.
- Revenue retention alongside donor retention. Retaining 80% of donors who collectively give less than last year is a decline that donor counts alone will hide. FEP’s own 2025 picture makes the point: revenue up an estimated 5.0%, donors down 3.6%.
Label every one with its window on the same slide. A retention figure without a period attached is not a benchmark — and six of the ten sources in the table at the top of this page are exactly that.
Getting from these numbers to a fundraising programme that moves them is the harder half, and it is the work we do with nonprofit and impact organisations: measurement that survives a board meeting, then the acquisition and stewardship to change what it measures.
09 / Reader questions
Frequently asked questions
01What is a good donor retention rate?
Around 43% measured over a full calendar year, which is where the sector average sits. The Fundraising Effectiveness Project put its US panel at 43.3% for 2025 against 43.1% for 2024. Before comparing, check the window: the same project reports 18.0% year-to-date at the end of Q1 2026, and Virtuous reports 54.73% on a 24-month lookback.
02How do you calculate donor retention rate?
Divide the number of last period's donors who gave again this period by the total number of donors in that last period, then multiply by 100. If 300 people gave last year and 159 of them gave again this year, retention is 53%. The formula is the easy part; the definitions of donor and of period are where published results diverge.
03What is a good first-time donor retention rate?
Roughly 20-25% over a full year, against about 60% for donors who have already given more than once. Bloomerang publishes an FEP-derived set of 23% for first-time donors, 60% for repeat donors and 46% overall. Judging a first-year cohort against a blended sector figure in the forties will make a perfectly healthy acquisition programme look broken.
04Is a 90% retention rate good?
For monthly recurring donors it is roughly the published norm; for a whole donor file it is implausible enough to be worth auditing. Bloomerang reports 90% retention among monthly recurring donors against 46% overall. A 90% figure across an entire file usually means a long lookback window, a major-gift-only segment, or donors counted twice.
05What does an 80% retention rate mean?
That 80 of every 100 donors who gave in your previous period gave again in the current one, and 20 did not. It says nothing about money: those 80 may collectively give less than the 20 who lapsed. Publish retention next to the revenue the retained donors actually produced, or the number flatters you.
06What is the typical donor recapture rate?
Under 10% a year. Dataro's 2024 analysis found 9.8% of lapsed donors are reactivated annually and cites FEP figures as low as 4%. Once reactivated, those donors retained at 40.4% in 2023, better than first-time donors do. Few benchmark reports publish a recapture rate at all, so treat any single figure as directional.
07What is the 80/20 rule for nonprofits?
The observation that most revenue comes from a small share of donors, conventionally framed as 80% of income from 20% of the file. It is a rule of thumb rather than a measurement, and no major benchmark report tests it directly. FEP's 2025 figures are at least consistent with a narrowing base: dollars raised grew an estimated 5.0% while the number of donors fell 3.6%.