Published
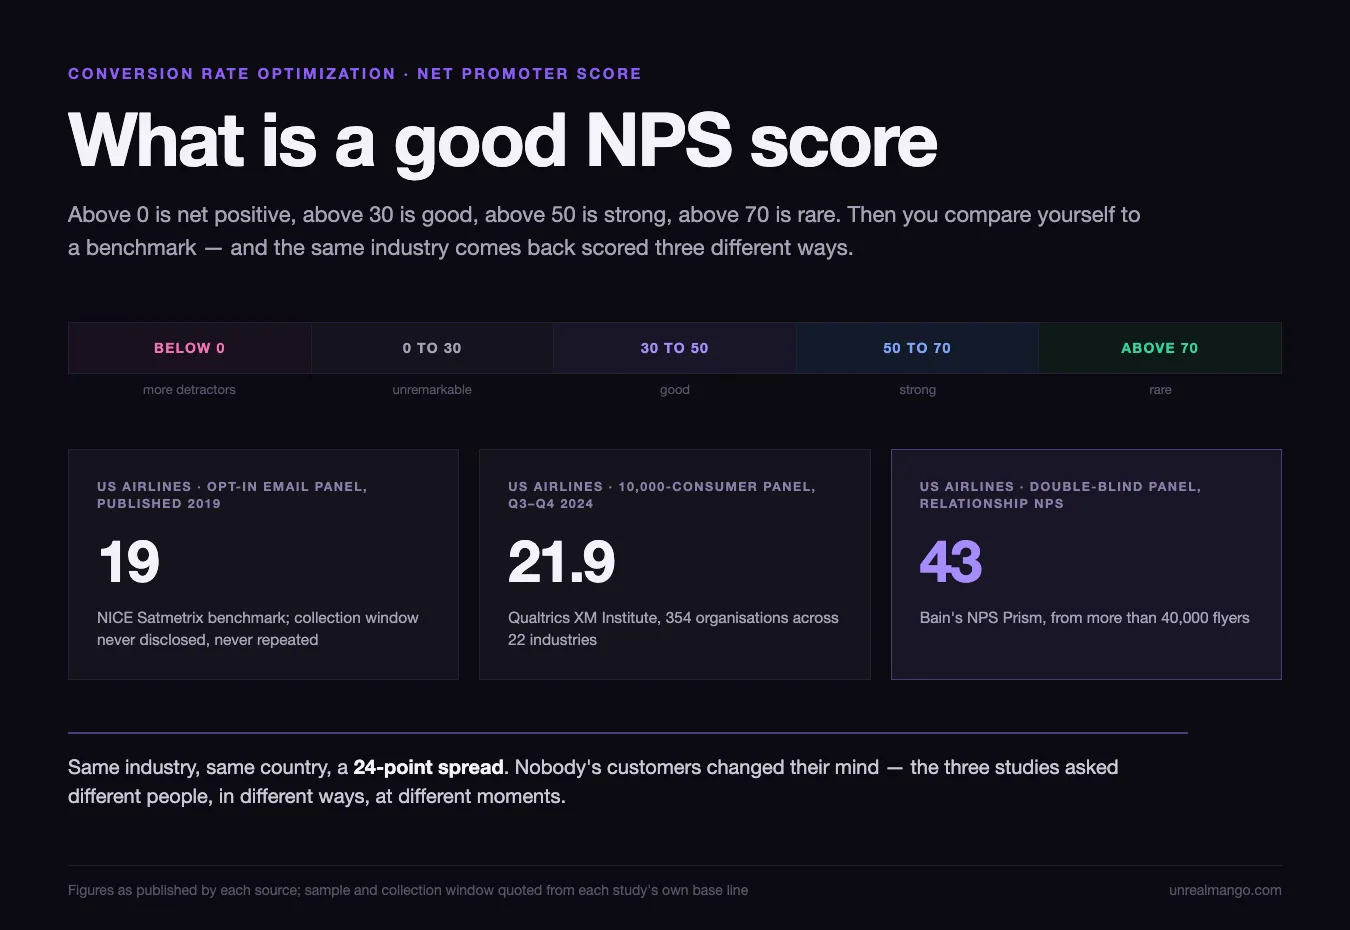
A good NPS score is anything above 0, since that means promoters outnumber detractors. Above 30 is good, above 50 is strong, and above 70 is rare. The harder question is which benchmark you are holding it against, because most published benchmarks measure something your own survey does not.
How this was checked. For this query in the United States on 23 August 2026, Google returned a large AI Overview with the standard bands, a People Also Ask block of six questions, and nine organic results led by Qualtrics, SurveyMonkey, ChurnZero, Medallia and Bain’s NPS Prism. Between them they publish the same four bands and a table of industry averages. Not one of them states which of Bain’s three types of NPS its table measures — and that single omission is why the tables disagree by more than twenty points on the same industry in the same country. Every benchmark figure below is quoted with the sample size and collection window its publisher discloses. Where a publisher discloses neither, that is said instead of the number being folded into an average.
The NPS bands, and why a score is never a percentage
Net Promoter Score asks one question — how likely are you to recommend this company to a friend or colleague, on a scale of 0 to 10 — and reduces the answers to a single number. Respondents scoring 9 or 10 are promoters, 7 or 8 are passives, and 0 through 6 are detractors. The score is the promoter share minus the detractor share, so it runs from -100 to +100.
| Score | What it means | Roughly how common |
|---|---|---|
| Below 0 | More detractors than promoters | A minority of consumer brands, concentrated in utilities, ISPs and car rental |
| 0 to 30 | Net positive, unremarkable | Where most industry averages sit |
| 30 to 50 | Good | Above all but the top industry averages in the 2024 Qualtrics XM Institute US consumer benchmark, where the highest was grocery at 34.3 |
| 50 to 70 | Strong | Individual leading brands, not industries |
| Above 70 | Rare | Usually a self-reported figure with no disclosed sample |
Two things follow from the construction that the bands table never says out loud.
It is points, not per cent. Because the score is a difference between two percentages, the result is a number of points. A company where 70% of respondents are promoters and 15% are detractors has an NPS of 55, not 70. Asking whether “70% NPS” is good is asking about two different quantities at once.
Identical scores can hide opposite distributions. Cazzaro and Chiodini, writing in The TQM Journal in 2023, put the objection plainly: “identical index values can correspond to different levels of customer loyalty,” which “makes [it] difficult to determine whether the company is improving/deteriorating in two different years.” The arithmetic is easy to see. A company where every single respondent gives a 7 scores 0. So does a company where 30% give a 10, 30% give a 0, and 40% give a 7. The first has no enemies and no advocates; the second is being pulled apart. NPS reports them as the same company.
The cut points themselves are a convention rather than a finding. Kristensen and Eskildsen, in a 2011 IEEE conference paper working with Danish insurance data from about 3,400 respondents, ran a clustering analysis and arrived at detractors 0 to 4, passives 5 to 7 and promoters 8 to 10 — not Reichheld’s boundaries. Their verdict on the metric was blunt: “The best we can say about NPS is that it is a mistake!”
None of this makes the score useless. It makes it a rough instrument whose readings are only comparable to other readings taken the same way — which is exactly what the next section is about. If you are weighing NPS against other single-question instruments, the product-market fit survey asks about personal loss rather than willingness to recommend, and the two routinely disagree.
Bain names three types of NPS, and warns against comparing the first two
Most articles on this topic treat NPS as one metric. Bain, which owns the method, does not. Its own reference page names three types, each with a different trigger, cadence and sample.
| Type | When it is asked | Typical cadence | Who is in the sample |
|---|---|---|---|
| Relationship NPS | With no initiating trigger — a periodic check on the whole relationship | Often once or twice a year | Your known customers |
| Experience NPS | Triggered by a completed action: an online transaction, a support call, a delivery | Bain’s stated maximum is once every three months per customer | Customers who just interacted |
| Competitive benchmark NPS | Fielded by a third party, double-blind, covering you and your rivals | Not stated by Bain | A market sample, including customers you do not have |
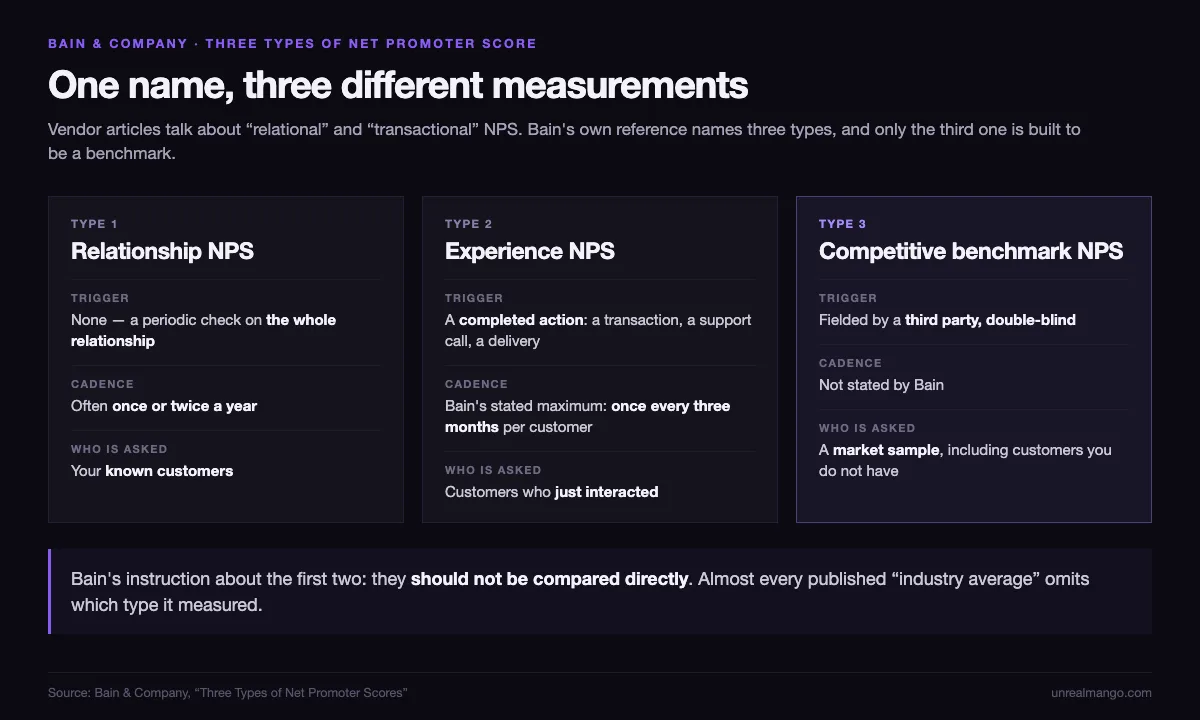
The vocabulary you see in most vendor articles — “relational NPS” and “transactional NPS” — maps onto Bain’s first two types. The third one is usually missing from those articles entirely, which matters, because the third one is the only type that is actually a benchmark.
Bain’s own instruction is the sentence to carry away: relationship and experience scores should not be compared directly. They ask different people at different moments about different things. An experience score is dominated by the last interaction, which is why it swings violently — Bain’s NPS Prism reports that delayed airline passengers score 45 points lower than on-time ones, and 81 points lower when the delay notification is not timely. A relationship score, asked of the whole base with no trigger, absorbs those episodes into a running average.
There is one more thing worth saying because nobody else says it: a paired measurement of the same company’s relationship and experience NPS, published by anyone who discloses their method, does not appear anywhere we could find it. The claim that transactional scores “typically run higher” circulates across a dozen vendor blogs, none of which cites a primary source and several of which cite each other. Bain declines to compare the two. Qualtrics’ own explainer on the pair puts no number on the difference. CustomerGauge states outright that “combining the scores of different NPS surveys is never recommended.” If a vendor tells you your transactional score should be X points above your relational one, ask where the number came from.
Who was asked explains why airlines score 19 in one table and 43 in another
Put the published benchmarks for a single industry side by side and they do not agree. Airlines is the clearest case, because three independent publishers have scored it.
| Industry | Qualtrics XM Institute | Bain’s NPS Prism | NICE Satmetrix | Retently |
|---|---|---|---|---|
| Airlines | 21.9 | 43 (relationship NPS) | 19 | — |
| Retail / ecommerce | 33.0 | — | 59 (department stores) | 61 |
| Banking / checking and savings | 28.0 | 39 (product NPS) | 36 | — |
| Software / SaaS | 21.1 | — | 34 | 41 |
| Wireless / cellular | 27.4 | 20 | 30 | — |
| Grocery | 34.3 | 34 (relationship NPS) | 40 | — |
| Utilities | 16.0 | 15 | — | — |
| Measured on | 10,000 US consumers, 354 organisations, 22 industries, Q3–Q4 2024 | 20,000+ respondents per industry on average, double-blind panel, refreshed quarterly | US consumers, opt-in email survey; study published 2019, collection window not disclosed | “At least 10,000 surveys,” collection window not stated |
Notice that the metric changes inside a single column. NPS Prism publishes several distinct scores, and 43 for airlines is a relationship score while 39 for checking and savings is a product score. That is the problem in miniature: the word “NPS” on a benchmark page is doing far less work than it appears to.
Grocery and utilities land within a point or two across sources. Everything else scatters, and the scatter is not random — it tracks how much room each protocol leaves for the answer to move.
The mechanism is who ends up in the sample:
- Qualtrics XM Institute recruits an independent consumer panel and asks people about brands they use. Nobody in that sample was selected by the brand, and nobody is answering a survey the brand sent.
- NPS Prism goes further and runs the survey double-blind: in Bain’s words, “your company’s and Bain’s involvement both remain unknown to the survey respondent.” Bain’s stated reason for building this type is to eliminate responder bias — a concession that its first-party scores carry it.
- Retently aggregates scores from surveys run by its own customers. Every respondent was chosen by a brand, sent a survey by that brand, and chose to answer it. The population is companies that bought CX software, and the individuals are the subset willing to respond.
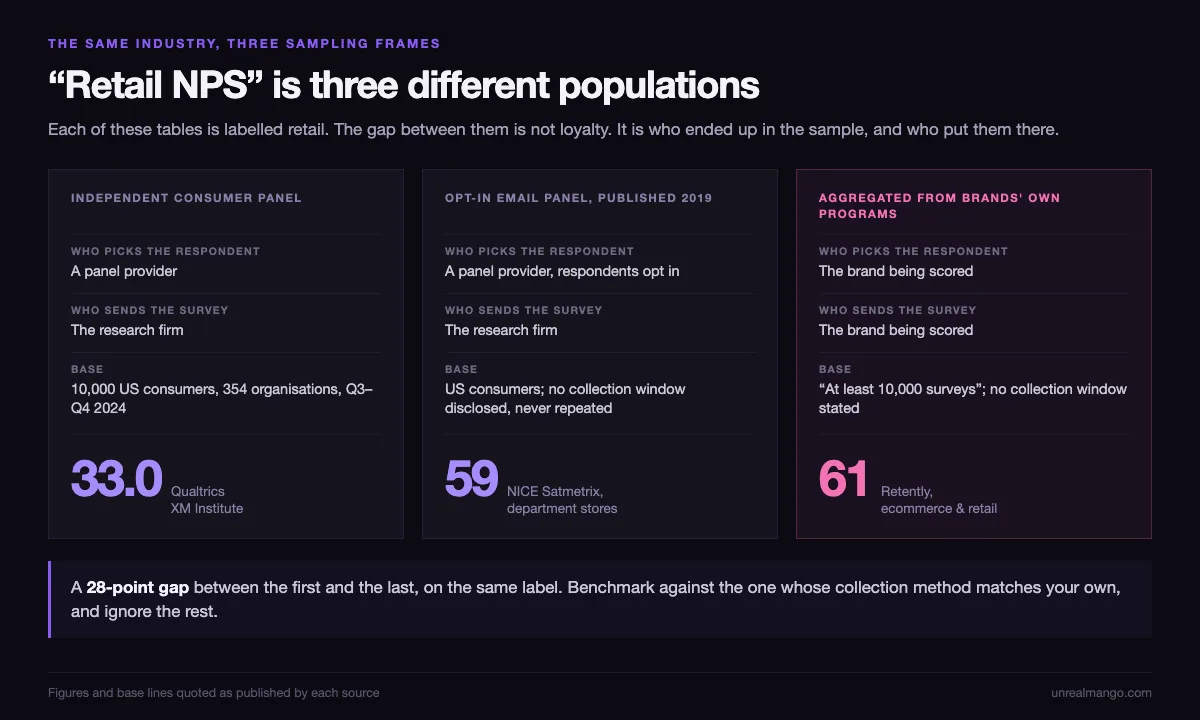
That last one explains the 28-point gap between XM Institute’s retail figure of 33.0 and Retently’s ecommerce and retail figure of 61. Both are labelled “retail NPS.” They are not measuring the same universe of people.
Forrester, which runs the largest of these studies — more than 275,000 customers across 478 brands, 13 industries and 13 countries in its 2025 global rankings — gives the same warning from the other direction. It advises clients against comparing their internal measurements to its published benchmarks, because survey methodologies and sampling differ. The organisation with the biggest benchmark dataset in the market is telling you not to benchmark against it.
NPS benchmarks by industry for 22 US consumer categories
If you want one table to orient yourself, use the one with the base line printed on it. Qualtrics XM Institute’s most recent public consumer benchmark covers 22 industries, and its stated base is “10,000 U.S. Consumers, 354 organizations, 22 industries,” collected in the third and fourth quarters of 2024.
| Industry | NPS | Industry | NPS |
|---|---|---|---|
| Grocery | 34.3 | Social media | 24.2 |
| Retail | 33.0 | Health insurance | 22.3 |
| Consumer payment | 31.5 | Insurance | 22.0 |
| Streaming media | 30.9 | Airlines | 21.9 |
| Investment firm | 30.5 | Hotel | 21.9 |
| Fast food | 28.7 | Software firm | 21.1 |
| Bank | 28.0 | Computer and tablet makers | 20.7 |
| Parcel delivery | 27.9 | Electronics | 16.5 |
| Wireless | 27.4 | TV/internet service provider | 16.2 |
| Food takeout and delivery | 27.3 | Utilities | 16.0 |
| Auto | 26.9 | Car rental | 15.8 |
The whole table lives between 15.8 and 34.3. That is the useful fact in it: on an independent consumer panel, an entire industry rarely clears 35. When a vendor page tells you the average NPS is 44, it is reporting from a different kind of sample.
The same publisher’s earlier wave did print an overall figure: an average NPS of 18 across 22 industries, from 10,000 US consumers and 351 brands surveyed in the third quarter of 2023. Use it as an older floor rather than as today’s average, and do not draw a line between the two waves. Every one of the 22 industries moved upward between them, and a uniform shift across an entire panel usually means something changed in the study rather than in the market.
Three practical cautions about industry tables generally:
- Check what year the data was collected, not what year the page says. A “2026 benchmark” is usually 2025 or 2024 data. A good number of the industry figures still circulating on 2026 pages trace back to a NICE Satmetrix consumer benchmark published in 2019 and never repeated since. Brand-level scores are worse: the famous near-perfect numbers attached to a handful of consumer brands come from aggregator sites and one-off owner surveys, not from any NPS program the companies themselves publish.
- An industry average is not your segment. Cross-industry benchmarking on averaged panel data hides the same subgroup problem that shows up across market research generally, and averaged figures do not transfer down to a slice of the market that was never separately sampled.
- The best-documented brand satisfaction data in the US is not NPS at all. The American Customer Satisfaction Index publishes brand-level figures on a fully disclosed random sample — its 2025 restaurant study is based on 16,381 completed surveys collected by email between April 2024 and March 2025 — but it is a 0-to-100 index and cannot be converted.
Good NPS for SaaS, healthcare and retail depends on which list you read
The B2B and B2C question is really the protocol question again, because the lists most people find for B2B come from vendors aggregating their own customers’ survey programs. Retently’s figures are the ones most widely quoted:
| Segment | Industry | Retently | Nearest independent-panel figure |
|---|---|---|---|
| B2B | Financial services | 68 | Bank 28.0 (XM Institute) |
| B2B | Consulting | 68 | — |
| B2B | Technology and services | 63 | — |
| B2B | Software and SaaS | 41 | Software firm 21.1 (XM Institute) |
| B2B | Healthcare | 37 | Health insurance 22.3 (XM Institute) |
| B2B | Cloud and hosting | 30 | — |
| B2C | Ecommerce and retail | 61 | Retail 33.0 (XM Institute) |
| B2C | Logistics and transportation | 42 | Parcel delivery 27.9 (XM Institute) |
| B2C | Communication and media | 39 | TV/internet 16.2 (XM Institute) |
| B2C | Internet software and services | 26 | — |
Every row where a comparison exists shows the vendor-aggregated figure running roughly 14 to 40 points above the independent panel. The disclosure behind those numbers is thin: “at least 10,000 surveys,” industries with more than 10 client companies, no country split, no collection window, and no statement of whether the underlying surveys were relationship or experience surveys.
So the honest answer to “what is a good NPS for SaaS” has two parts. If you run a periodic relationship survey to your whole customer base, you are closer to the panel world, and 30 to 40 is a genuinely good result. If your number comes from post-ticket or post-onboarding surveys with a 10% response rate, you are in the vendor-aggregate world, and 41 is unremarkable there. The two answers differ by more than the difference most teams are trying to create.
B2B has one structural difference worth naming separately: your respondent is often not your buyer. In a consumer survey the person answering pays the bill. In B2B the end user answering the survey may not renew the contract, and the economic buyer may never see one. A B2B NPS collected only from daily users is measuring product experience, not renewal risk.
Four things that move your NPS without a single customer changing their mind
How you asked. Mode effects on survey scores are well documented and they are large. Gallup ran a randomised experiment on its own panel and found that phone administration produced higher “strongly agree” rates than web on all eleven attitudinal items tested, by 4 to 16 points. On a specifically NPS-shaped case, Great Brook Consulting reported that one B2B company, running 750,000 service transactions a year, scored 58.1 by telephone against 18.0 by web form on the same transactional survey in the same month — a 40-point gap, with 54% giving a 10 by phone against 27% on the web. That case was not randomised, since customers with an email address on file got the web form, so composition is tangled up with mode. The direction, though, matches the Gallup experiment: a human on the line pulls answers upward. If you move a survey from phone to in-app, your NPS falls without anything about your product changing.
Who bothered to answer. Bain’s own guidance, published in 2012 by Rob Markey and Fred Reichheld, sets response-rate red flags at anything below 40% for consumer businesses and 60% for B2B. Almost no in-app or email NPS program reaches those numbers. And Bain’s suggested correction is far more aggressive than anything vendors recommend: “consider scoring all nonresponders as detractors (probably not too far off in business-to-business settings) or as a 50-50 mix of passives and detractors.” Take that seriously for a moment. A program with a 15% response rate reporting an NPS of 45 is describing the 15% of customers who were willing to fill in a form, and the method’s own authors think the silent 85% skew detractor.
Reichheld himself catalogued the failure modes in 2021: “pleading (‘I’ll lose my job if you don’t rate me a 10’), bribery (‘we’ll give you free oil changes for a 10’), and manipulation (‘we never send surveys to customers whose claim was denied’).” He noted that firms publish scores with no explanation of the process behind them and without disclosing which customers were surveyed, how many, or the response rates.
Where your customers live. This is the largest single effect in the literature and it has nothing to do with satisfaction. Qualtrics XM Institute surveyed 17,509 consumers across 18 countries in the first quarter of 2021 and asked each of them to score companies they like and companies they dislike. Holding sentiment constant that way isolates response style, and the spread is enormous.
| Country | NPS for companies they like | Country | NPS for companies they like |
|---|---|---|---|
| India | 64 | Malaysia | 35 |
| Mexico | 60 | Philippines | 34 |
| Brazil | 54 | Hong Kong | 31 |
| Thailand | 52 | United Kingdom | 29 |
| Indonesia | 47 | Spain | 26 |
| United States | 36 | Australia | 26 |
| Germany | 24 | Singapore | 22 |
| Canada | 20 | France | 16 |
| South Korea | -11 | Japan | -47 |
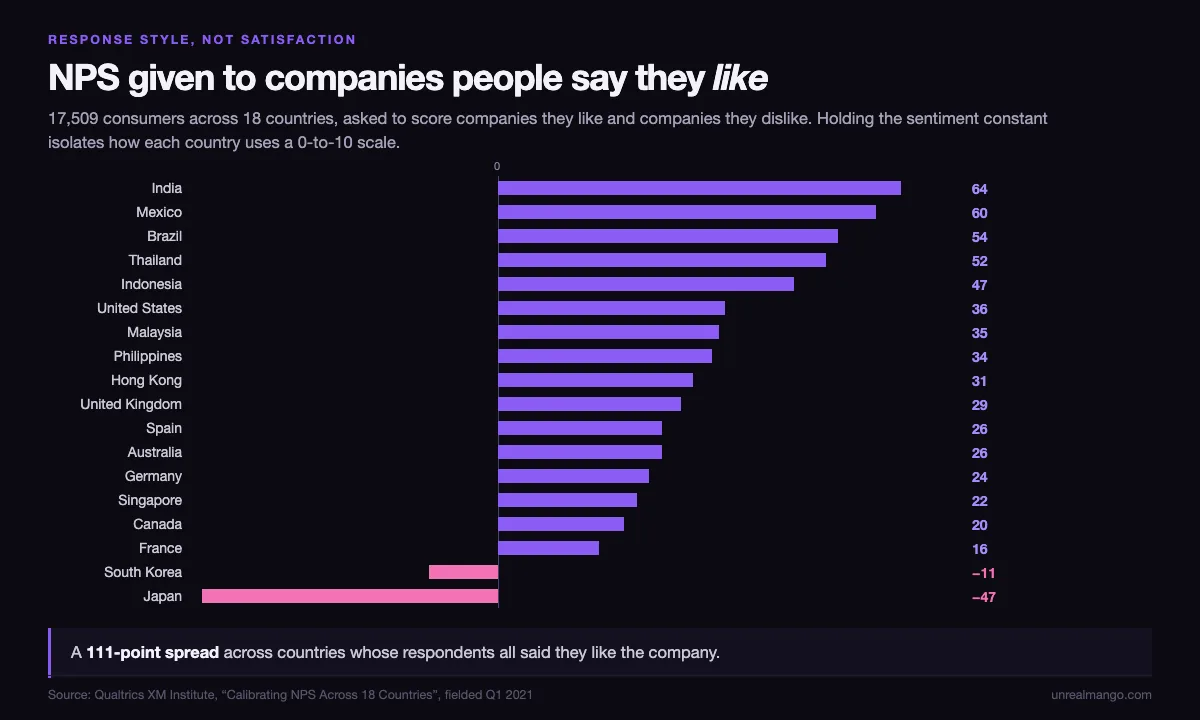
A Japanese customer who likes your company still returns a negative NPS. A French customer who likes you scores you 20 points below an American who likes you exactly as much. If your customer mix shifts toward Europe or Japan, your global NPS drops and your product is unaffected. Bruce Temkin, who ran the study, recommends country-specific goals and suggests abandoning NPS entirely in markets where the like-versus-dislike spread is too narrow to discriminate — which, on his own data, includes Japan, South Korea, Hong Kong and India.
Which numbers you printed on the scale. Use 0 to 10. Courser and Lavrakas ran split-ballot experiments on the Buckeye State Poll and found the 1-to-10 version produced more item nonresponse than 0-to-10 — clearly in the first study, 19.4% against 16.1%, and only marginally in the second, 20.6% against 20.3% — with an anchored 0-5-10 scale lowest of all at 11.7% and 13.9%. Their paper does not report whether mean scores shifted, so the honest claim is that scale format changes who answers rather than that it changes the score. Pew found something adjacent when it randomised the numbering of an ideology scale: the numbers moved how people sorted themselves into categories while leaving their actual attitudes alone. Sorting into categories is precisely what NPS does for a living.
The error bar around your NPS is wider than the change you are chasing
Before you decide whether 47 beats last quarter’s 44, find out how much precision your sample size bought. Because NPS is built from two dependent proportions, its variance is not the familiar one, and Lewis and Sauro published the sample sizes it implies using an adjusted-Wald interval at maximum realistic variance:
| Precision you want | Responses at 90% confidence | Responses at 95% confidence |
|---|---|---|
| ±10 points | 200 | 286 |
| ±15 points | 88 | 126 |
| ±20 points | 48 | 70 |
At 70 responses your score carries a margin of roughly 20 points at 95% confidence. A move from 44 to 47 on that sample is not a move. It is the same number reported twice.
Two further findings sharpen this. Turk, Cinderich and McNeill simulated NPS confidence intervals across four population shapes in 2026 and found that the standard Wald and bootstrap-t intervals give inadequate coverage at small sample sizes and should not be used — and that interval width depends on the shape of the underlying answer distribution, which is the same reason two companies with identical scores are not in identical positions. Separately, John Dawes has shown that the counting method used to build NPS introduces additional variation compared with simply averaging the 0-to-10 answers. The net score is noisier than the mean it discards.
The related question — how many responses you need before a difference between two groups is real — is a different calculation with its own traps, and worth doing properly rather than eyeballing.
Does a high NPS predict growth? The evidence is thinner than the claim
The original 2003 claim was that the recommendation question predicts growth better than any other measure. That claim has been tested repeatedly since, and it has not held up in the strong form.
The 2007 replication attempt. Keiningham, Cooil, Andreassen and Aksoy published a longitudinal examination in the Journal of Marketing using data from the Norwegian Customer Satisfaction Barometer — 21 firms and more than 15,500 interviews. Their abstract states that the research “fails to replicate his assertions regarding the ‘clear superiority’ of Net Promoter compared with other measures in those industries.” Their industry-level correlations with revenue change ran from .86 in security systems and .40 in banking down to .08 in transportation and negative figures in retail gasoline and home furnishings, where conventional satisfaction did far better. The paper won the Marketing Science Institute’s H. Paul Root Award, so it is not a hit piece. It also carries the authors’ own caveat, which most people quoting it skip: with only three to five firms per industry, even large differences between correlations were not statistically distinguishable.
The fairest replication. Jeff Sauro re-ran the analysis on Reichheld’s own dataset of 40 companies across seven industries, this time testing NPS against future financials rather than concurrent ones. NPS explained about 38% of the variability in growth over two years and about 30% over four — well short of the 76% originally reported on historical data, but not nothing. For scale, Sauro notes that SAT scores explain around 25% of first-year college grades, so 38% is respectable for a single survey question. By industry it swung wildly: 76% for UK supermarkets over two years against 8% for both US car rental and US airlines.
Sauro also identified the design problem in the original: the NPS figures were collected in 2001 and 2002 and correlated against growth from 1999 to 2002. That is concurrent validity, not prediction.
The most recent peer-reviewed test, and the most useful one. Baehre and colleagues, in the Journal of the Academy of Marketing Science in 2022, tracked seven US sportswear brands quarterly from 2013 to 2017 — 38,644 respondents, 193,220 NPS evaluations, 133 brand-quarter observations. Static NPS levels did not predict future sales growth at all. What did predict growth, at a one-quarter lag, was changes in brand-health NPS: the version asked of all potential customers rather than only existing ones.
That result is the empirical version of the argument this whole article makes. Which population you ask decides what the number can tell you. A score collected from your own customers, who already chose you, cannot see the market forming an opinion about you.
What the inventor did next. In 2021 Reichheld and his co-authors introduced Earned Growth as, in their words, the accounting-based counterpart to NPS — built from net revenue retention and the share of new customers arriving through referrals. Eighteen years after inventing a survey metric, he built a replacement out of accounting data, specifically to escape the survey-response problems above. That is a stronger argument about NPS’s limits than any critic has made.
Build a competitive cluster instead of borrowing an industry average
The fix for all of this is not a better table. It is measuring the thing a benchmark is supposed to give you — your position relative to the specific companies a customer would otherwise choose — on one consistent protocol. Bain’s third NPS type exists for exactly this, and NPS Prism sells it at scale, averaging more than 20,000 respondents per industry with double-blind fielding. You can run a smaller version yourself.
- Name five to seven direct competitors, the ones that appear in your actual deals, not the industry’s biggest logos. Category averages fail because they pool companies your customers would never consider alongside the two they were choosing between.
- Field one survey covering all of them, to a panel rather than to your own list. The point is that every brand in the study is scored under identical conditions by people who were not selected by any of them.
- Keep the respondent blind to who is asking, and randomise the order the brands appear in. Bain’s stated reason for building the double-blind version is that first-party surveys carry responder bias; an unblinded competitive study inherits it.
- Read the gap, never the level. Your absolute number carries the country, mode and scale effects described above. Every brand in your cluster carries the same ones, so the distance between you and the brand above you survives them.
- Freeze the protocol before you repeat it. Same panel provider, same wording, same 0-to-10 scale, same seasonality. Change one and the next wave is a new measurement rather than a comparison.
Run alongside it a second, internal relationship survey to your own base, and treat the two as answering different questions: the panel study tells you where you stand, the internal one tells you what is changing. Do not average them.
What to do with detractors, passives and promoters in the first 72 hours
A score you do not act on is an expensive way to generate a slide. The three groups need different responses on different clocks.
| Group | Score | The clock | What actually happens |
|---|---|---|---|
| Detractors | 0-6 | Contact within 24 hours | A named human, not a survey autoresponder. The goal of the call is the reason, in the customer’s words, not a rescue |
| Passives | 7-8 | Route within 72 hours | The largest group and the least worked. Ask what would have made it a 9 — passives usually name one specific missing thing |
| Promoters | 9-10 | Ask within 72 hours | While the sentiment is fresh: a referral, a review, a case study. Reichheld’s own successor metric counts customers who arrive by referral, which is the promoter group turned into revenue |
Two rules keep the loop honest. First, whoever owns the fix has to see the verbatim, not the number — an NPS report that arrives as a single figure cannot be acted on by anyone. Second, never suppress the sample: excluding customers whose ticket went badly is the manipulation Reichheld named, and it raises the score while destroying the only thing it was for.
The behaviour behind the score is usually visible before the survey is. Detractors abandon flows, bounce off pricing pages and never return; promoters come back directly, convert faster and refer. Watching those patterns in the conversion rate optimization work on your own site closes the loop faster than a quarterly survey does, because the site tells you where the experience broke while the survey only tells you that it did.
The short version. Above 0 is net positive, above 30 is good, above 50 is strong, above 70 is rare — and none of those bands means anything until you know whether the benchmark next to your score asked your customers, everyone’s customers, or nobody in particular.
11 / Reader questions
Frequently asked questions
01Is 70% NPS good?
A score of 70 is very good, but NPS is not a percentage. It is the promoter share minus the detractor share, expressed in points on a scale from -100 to +100, so 70 points and 70% of respondents are different quantities. A company where 70% are promoters and 15% are detractors has an NPS of 55, not 70.
02Is 40 a good Net Promoter Score?
Yes, in most contexts 40 is a good score: it sits above the conventional 30-point line and above every industry average in the 2024 Qualtrics XM Institute US consumer benchmark, where the highest single industry was grocery at 34.3 on a panel of 10,000 consumers. Whether it is good for you depends on the protocol behind it, because a score collected from your own post-interaction survey and a score collected from an independent panel are not comparable.
03Is 47 a good NPS score?
47 is a good score, close to the top of the 30-to-50 band and above every industry average in the Qualtrics XM Institute 2024 US consumer benchmark, where the highest industry figure was grocery at 34.3. It sits below the level Bain's NPS Prism reports for categories like airlines and banking, but those figures come from a different survey protocol, so the comparison is not like for like.
04Should NPS be 0-10 or 1-10?
Use 0 to 10, the scale Bain's method specifies. A split-ballot experiment by Courser and Lavrakas found the 1-to-10 version produced more item nonresponse than 0-to-10 (19.4% against 16.1% in one study), and the study did not measure whether mean scores shifted. The practical reason is simpler: the standard bands are defined on 0 to 10, so a 1-to-10 scale makes your score non-comparable with every published benchmark.
05What is a good NPS score for SaaS?
There is no single defensible figure. Qualtrics XM Institute put software firms at 21.1 on a 2024 panel of 10,000 US consumers, while Retently reported 41 for B2B software and SaaS from surveys run by its own customers. The 20-point gap is a protocol difference, not a loyalty difference, so pick the benchmark whose collection method matches yours and ignore the other one.
06What is Costco's NPS score?
There is no verifiable current figure. Costco has never published its own NPS. Third-party consumer benchmarks have scored large retailers, but the ones that disclose a sample are years old, and the figures around 50 that circulate on aggregator sites state no sample size, collection date or respondent selection at all. The best-documented current satisfaction measure for US retailers is the American Customer Satisfaction Index, which uses a disclosed random email sample, but it is a 0-to-100 index and cannot be converted into an NPS.
07What is Chick-fil-A's NPS score?
No verifiable NPS exists for Chick-fil-A. The figures repeated across aggregator sites cite no source, no sample and no date. What is documented is its ACSI score of 83 out of 100 in the 2025 Restaurant and Food Delivery Study, based on 16,381 completed surveys collected by email between April 2024 and March 2025 — a different metric on a different scale.
08How many responses does an NPS survey need?
For a margin of error of about 10 points at 95% confidence, roughly 286 responses, using the adjusted-Wald interval Lewis and Sauro published for NPS. Around 126 gets you to 15 points and 70 gets you to 20 points. Most small programs report a single score off fewer responses than that, which means the quarter-to-quarter movement they react to is inside the error bar.