Published
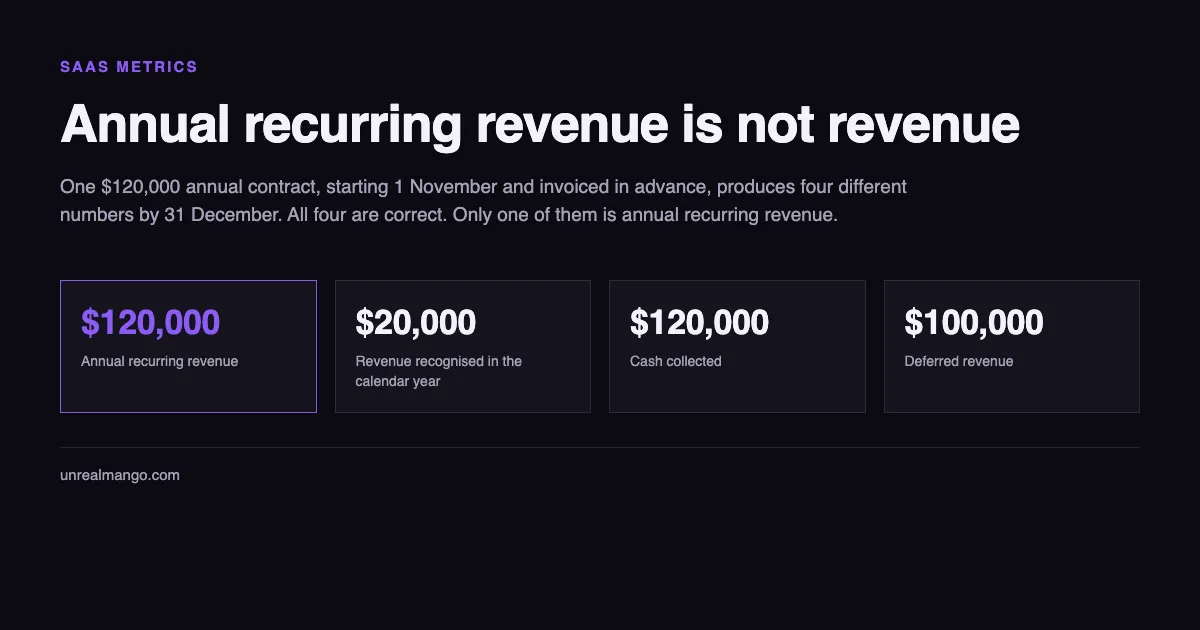
Annual recurring revenue is the value of your live, contracted subscription revenue expressed over twelve months: the most recent month’s recurring revenue multiplied by twelve. It is not revenue, not bookings, not cash, and not a run rate. One $120,000 contract produces four different numbers at once — annual recurring revenue, recognised revenue, cash collected and deferred revenue — and only the first is annual recurring revenue.
How this was checked. In August 2026 we compared what Google’s AI Overview for “annual recurring revenue” tells searchers against two documents almost nobody in that result set cites: the metric definitions published by the SaaS Metrics Standards Board, and the US Securities and Exchange Commission’s 2020 interpretive guidance on key performance indicators in MD&A, Release 33-10751. Where they disagree is where the money hides. Case figures come from the Department of Justice and SEC filings in the HeadSpin matter; pricing-model figures come from a January 2025 vendor survey whose sample is described below, with its limits stated.
The formula is last month times twelve, and every argument is about that month
The SaaS Metrics Standards Board — an industry body that publishes standardised definitions for B2B SaaS metrics — defines the metric in one sentence: “Annual Recurring Revenue (ARR) is recurring revenue, as defined by your revenue recognition policy, calculated on an annualized basis.” The formula it publishes is the one everybody quotes: the latest month’s recurring revenue multiplied by twelve.
Five things the same standard keeps out of the number:
- one-time fees;
- professional services;
- contracted revenue that is not yet live;
- consumption above a committed minimum;
- future events of any kind — expected churn, down-sell or up-sell stay outside the metric until they contractually occur.
In August 2026 the AI Overview for this query listed an exclusion set drawn from vendor glossaries: setup fees, professional services, consulting and cancelled accounts. Three of the five are missing from it. Signed-but-not-live contracts and consumption above a committed minimum are the two that let a number grow without a single new customer, and the summary most searchers read mentions neither.
There is also a quieter distortion in the multiplication itself. Burkland, an outsourced-CFO firm writing for early-stage SaaS in January 2024, points out that a $10,000-a-month contract going live mid-month is recognised as $5,000 in its first month under accrual accounting. Multiply that first month by twelve and a $120,000 contract reports as $60,000. Their fix is to stop reading the metric out of the ledger and treat it as a point-in-time question instead: as of the last day of the month, looking forward twelve months, what is contracted and live?
One $120,000 contract, four numbers, all of them correct
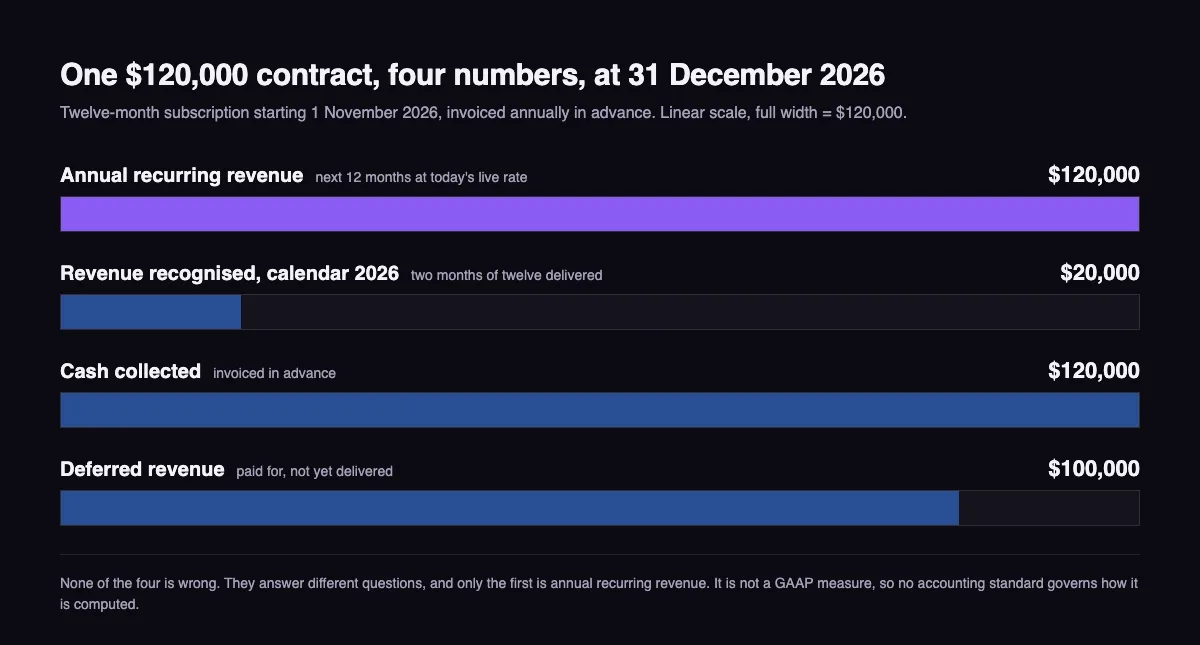
Take a single annual contract: $120,000, twelve months, starting 1 November 2026, invoiced in advance. At 31 December 2026 the company can truthfully publish four different figures.
| Number | Value at 31 Dec 2026 | What it answers |
|---|---|---|
| Annual recurring revenue | $120,000 | What are the next twelve months worth at today’s run of live subscriptions |
| Revenue recognised, calendar 2026 | $20,000 | What did accounting say we earned this year |
| Cash collected | $120,000 | What arrived in the bank |
| Deferred revenue | $100,000 | What we have been paid for but not yet delivered |
Two months of a twelve-month term were delivered, so $20,000 of the $120,000 is revenue and the remaining $100,000 sits as a liability. None of these four numbers is wrong. They answer different questions, and a deck that shows the largest one without saying which question it answers is not lying — it is letting the reader pick the wrong question.
This is also why annual recurring revenue never appears in audited financial statements. It is not a GAAP measure, so no accounting standard governs how it is computed. The only rulebook that comes close is a regulator’s guidance on metrics in general, which we get to below.
Multi-year contracts: one year forward, and only one
The rule here is unambiguous and routinely broken. The SaaS Metrics Standards Board states that for multi-year agreements “the amount contributed to ARR should be only the latest month’s MRR x 12, not the future value of contracted ARR beyond the current month.”
A three-year contract at $100,000 a year produces:
- $100,000 of annual recurring revenue;
- $300,000 of total contract value, which is a bookings number;
- $100,000 of contracted annual recurring revenue, because that metric also looks only one year forward.
Presenting $300,000 as annual recurring revenue triples the figure on a single signature. It is the easiest inflation in this article to spot, because the arithmetic gives it away: divide the claimed number by the customer count and see whether the implied price per customer matches the published price list.
The error also runs the other way, and honest founders lose money on it. Burkland describes enterprise contracts with escalations written in — a heavy discount in year one, full price afterwards. A three-year deal at $60,000 in year one and $100,000 in years two and three reports $60,000 of annual recurring revenue today while $200,000 of contracted value sits outside the metric entirely. If your contracts escalate, publish the backlog next to the metric rather than quietly hoping someone asks.
Usage-based pricing: only the floor is contracted
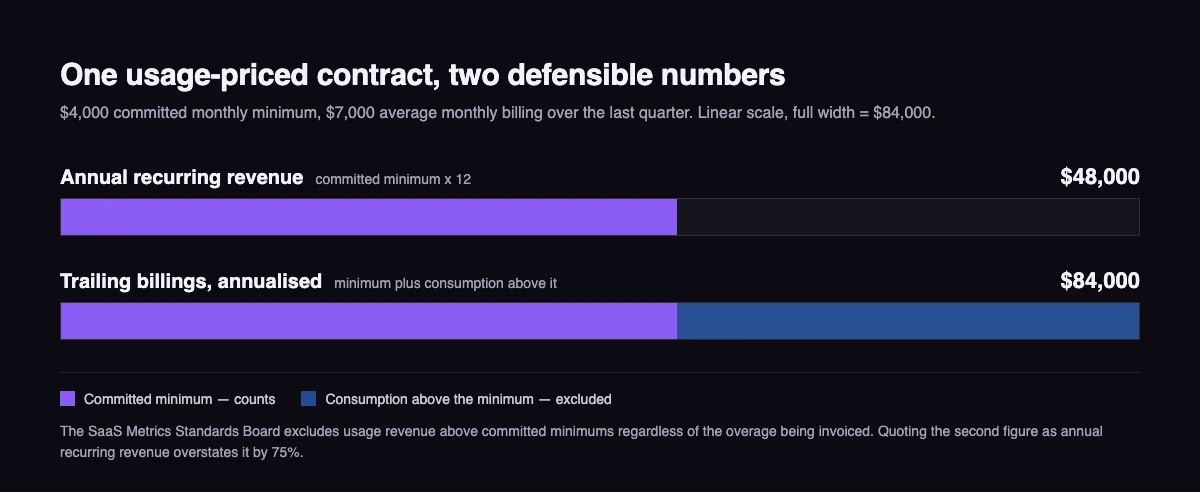
Consumption pricing strains the formula: if the amount billed is decided by what the customer did last month, most of it was never committed to. The standard resolves this by drawing the line at the floor — and where there is no minimum commitment at all, it says there is no annual recurring revenue to report, only trailing billings. Revenue from usage-based pricing that exceeds committed minimums “should not be part of ARR — regardless of the overage being invoiced.”
Applied to a real contract:
| Input | Value |
|---|---|
| Committed monthly minimum | $4,000 |
| Average monthly billing, last quarter | $7,000 |
| Annual recurring revenue under the standard | $48,000 |
| Trailing billings, annualised | $84,000 |
Quoting the second figure as annual recurring revenue overstates it by 75%. That is not a rounding difference, and it is the single most common place a modern SaaS number goes soft, because the share of companies with something consumption-priced to argue about has grown.
How grown is harder to say than the headlines suggest. A January 2025 survey run by Metronome with Greyhound Capital reported that 85% of respondents either had usage-based pricing in place or were adopting it, across a sample of 100 SaaS companies spanning application, vertical and infrastructure software, from under $20M to over $100M in annual recurring revenue. Treat it as directional rather than as a market measurement: the report does not disclose how respondents were selected or what the response rate was, and Metronome sells usage-based billing infrastructure. It is the clearest published number available; it is also a vendor’s customer-adjacent panel.
Net, gross and churn-adjusted: what gets subtracted, and when
Movement in the metric over a quarter has four components: new business, expansion of existing accounts, contraction of existing accounts, and churn. Net new annual recurring revenue is the first two minus the last two.
On a company opening the quarter at $2,400,000:
| Component | Value |
|---|---|
| New | +$180,000 |
| Expansion | +$95,000 |
| Contraction | −$40,000 |
| Churn | −$130,000 |
| Net new | +$105,000 |
| Closing annual recurring revenue | $2,505,000 |
Adding only the two positives gives $275,000, which is 2.6 times the net figure and is what “we added $275,000 last quarter” usually means. Both numbers are real; only one of them describes what happened to the business.
Timing matters as much as sign. The board’s rule is that churned and down-sold amounts come out in the month the churn or down-sell contractually occurs, not when someone learns the customer intends to leave. That keeps the metric from being quietly written down on rumour, and it also means a company can be technically accurate today while knowing next quarter is already lost. If retention economics are what you actually want to understand, the churn rate belongs in a lifetime-value calculation rather than in this one — our walkthrough of the customer lifetime value formula shows where the division happens and what it hides.
Contracted, committed and live: three numbers, one label
Contracted annual recurring revenue — CARR — is defined by the same board as contracted revenue “whether in production or not yet in production.” The board is blunt that this is a separate metric: ARR “is a different metric than CARR, has a different calculation formula and the two terms should not be used interchangeably.”
The difference is a deal that is signed but has not started billing. It belongs in the contracted figure and is explicitly excluded from annual recurring revenue. For a company closing enterprise deals with long implementations, the gap between the two can be a quarter’s worth of growth, which makes swapping the labels the most respectable-looking way to inflate a number: every dollar is backed by a real signature.
Three questions separate them in a diligence conversation, and none requires access to the ledger:
- Is every contract in this number currently invoicing?
- What is the earliest start date among contracts already counted?
- What does the same number look like with signed-but-not-live deals removed?
Four ways the number gets inflated on a traction slide
Each of these produces a bigger figure without a single false statement, which is why they survive a first reading.
| Move | What it looks like on the slide | The question that ends it |
|---|---|---|
| Folding one-time fees and overage into the month before multiplying | Metric climbs in the quarter a big implementation lands | What was the recurring portion of that month, excluding fees and consumption |
| Picking the strongest month rather than the most recent one | A figure that never moves down, quarter after quarter | Which month is this, and what does the most recent closed month give |
| Counting signed-but-not-live | Growth appears before any product usage does | How much of this is contracted rather than live |
| Reporting gross of churn | New business quoted, cancellations not | What is net new, and what is the closing figure |
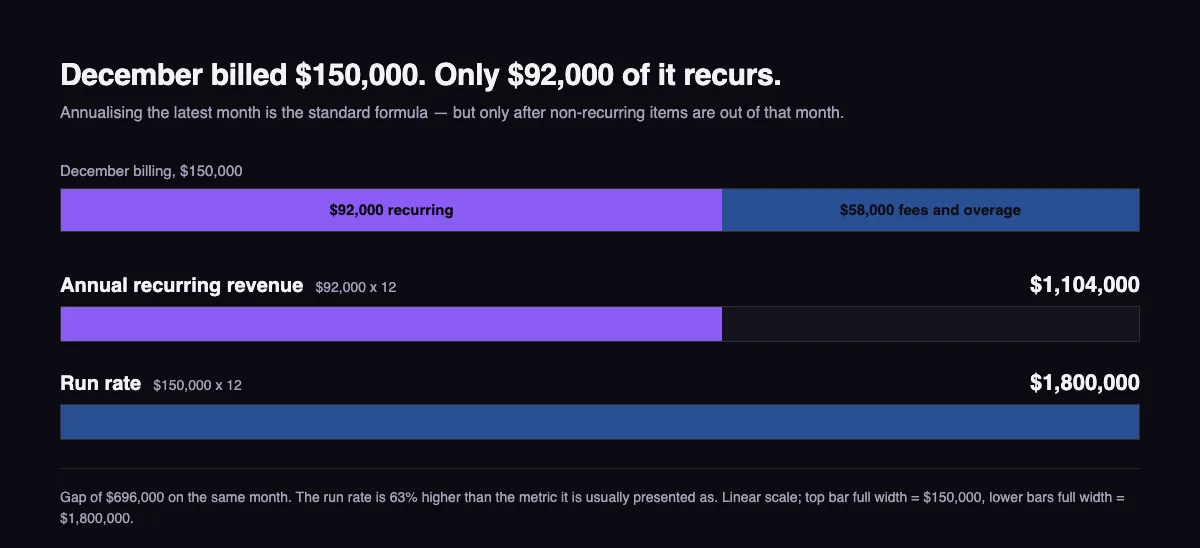
The first is the one worth spelling out, because the standard formula appears to endorse it. Annualising the latest month is correct — but only after non-recurring items are out of that month. A company billing $150,000 in December, of which $58,000 was implementation fees and consumption above committed minimums, has $92,000 of recurring revenue and $1,104,000 of annual recurring revenue. Annualising the full $150,000 gives $1,800,000. That is a run rate, and it is 63% higher than the metric it is being presented as. Google’s own related searches for this term include “Is ARR annual recurring revenue or annual Run Rate”, which suggests the confusion is doing real work in the market.
There is a documented case with figures attached. The Department of Justice charged HeadSpin founder Manish Lachwani over statements to investors: he represented annual recurring revenue of more than $33 million as of the second quarter of 2018 and $54 million for 2019 when, in the department’s words, it was “far less” in both years. The company raised over $100 million between April 2017 and April 2020 at a valuation of roughly $1.1 billion. The department identified three practices: amounts from potential customers that had not agreed to pay subscription fees, amounts larger than real customers had agreed to pay, and amounts from customers that had stopped using and paying for the service. The first and third are the table’s third and fourth rows pushed past the point where any definition could defend them. The second is not a definitional move at all, and that is where the line into fraud sits. Lachwani pleaded guilty and was sentenced to 18 months in prison.
Where this belongs in a deck is a narrower question than how to build one. The traction slide is where the number lands and where it gets read fastest; our breakdown of what goes in a pitch deck covers the section order and how long each part gets.
Three disclosure lines a regulator asks for, and the fourth thing it says to consider
Private companies file nothing, so no rule governs how they present this metric. Public ones operate under guidance that is worth stealing wholesale. In its 2020 interpretive release on key performance indicators in MD&A, Release 33-10751, the SEC said it would generally expect three disclosures to accompany a metric:
- a clear definition of the metric and how it is calculated;
- a statement of why the metric provides useful information to investors;
- a statement of how management uses it in managing or monitoring the business.
Separately from that list, the release says a company should also consider whether there are estimates or assumptions underlying the metric or its calculation, and whether disclosing them is necessary for the metric not to be materially misleading. On a privately held number built from contracts nobody outside the company can see, that fourth point is doing most of the work.
The release also addresses the move that causes the most damage in practice: changing the calculation. When a company modifies how a metric is calculated or presented, it should disclose the differences against prior periods, the reasons for the change, the effects on the amounts reported and previously reported, and should evaluate whether prior metrics need to be recast.
That last point converts directly into a diligence question for any private company. If the definition changed between the last raise and this one — a minimum reclassified as recurring, pilots brought inside the count — then the growth curve on the slide is partly a definitional artefact, and the honest version of the chart restates every prior period on today’s definition.
What $1 million in annual recurring revenue actually says
It says the live subscription base is worth $1 million over the next twelve months at its current rate. Bessemer Venture Partners describes reaching that mark as the transition from an idea to a revenue-generating business, and as one of the metrics that helps a company raise a Series A.
It does not say who produces it. The same $1 million can be four enterprise customers at $250,000 or 2,000 self-serve accounts at $500, and those are different companies with different risks: the first loses 25% of its business when one procurement decision goes the wrong way. Nor does the figure carry a growth rate, a gross margin, or a payback period, which is why funding conversations move to those within a slide or two. If you are sizing spend against the number rather than reporting it, the median marketing spend as a share of it and the payback bands by company size are in our go-to-market strategy for startups guide.
For companies selling software rather than measuring it, the metric is also the axis every acquisition decision gets judged on — which is the thinking behind how we work with SaaS and technology teams.
A seven-line audit of your own number
Run this before the figure goes into a deck, a board pack or a lender conversation:
- Every contract counted is live and invoicing today.
- One-time fees, implementation and professional services are out.
- Consumption above committed minimums is out, whether or not it was invoiced.
- Multi-year deals contribute one year forward, not total contract value.
- Contracts that expired are removed; contracts you expect to lose are still in, and flagged separately.
- The definition matches the one used in the last set of numbers you published — or the difference is stated.
- The number is presented next to what it excludes, so nobody has to guess which of the four numbers a contract produces you have chosen.
The seventh line is the one that changes how the other six are read. A figure with its exclusions printed underneath survives diligence; the same figure alone invites the reader to assume the worst version of how it was built, and in a market that has watched a founder go to prison over this exact metric, that assumption is not unreasonable.
11 / Reader questions
Frequently asked questions
01What is the meaning of annual recurring revenue?
Annual recurring revenue is the value of a company's subscription revenue expressed over twelve months, based on what is contracted and live now rather than on what has been earned or collected. The SaaS Metrics Standards Board defines it as recurring revenue, as set by your revenue recognition policy, annualised.
02How do you calculate annual recurring revenue?
Take the most recent month's recurring revenue and multiply by twelve. The standard formula is monthly recurring revenue times twelve. The work is in the first number, not the multiplication: strip out setup fees, professional services, consumption above a committed minimum, and anything signed but not yet live, because none of those recur.
03What is the difference between revenue and annual recurring revenue?
Revenue is what accounting says you earned in a period; annual recurring revenue is a forward-looking snapshot of what you are contracted to earn over the next twelve months. A $120,000 annual contract starting 1 November adds $120,000 to annual recurring revenue immediately, but only $20,000 to that calendar year's revenue.
04What does $1 million in annual recurring revenue mean?
It means the company's live subscriptions are worth $1 million over twelve months at their current rate. Bessemer Venture Partners frames the $0 to $1 million stretch as the transition from an idea to a revenue-generating business and a metric that helps unlock a Series A. It says nothing about how many customers produce it.
05Is it annual recurring revenue or annual run rate?
They are two different numbers that produce the same figure only by accident. A run rate annualises a period's total revenue, including one-off fees and consumption spikes. Annual recurring revenue annualises the recurring portion only. In a month with heavy implementation billing, the run rate can be over 60% higher.
06Does annual recurring revenue include usage-based revenue?
Only the committed minimum. The SaaS Metrics Standards Board excludes revenue from usage-based pricing that exceeds committed minimums, and says so regardless of the overage being invoiced. A contract with a $4,000 monthly floor billing $7,000 contributes $48,000 of annual recurring revenue, not $84,000.
07Can you give an example of annual recurring revenue?
A customer on a $10,000 monthly subscription contributes $120,000. Ten of them make $1.2 million. If one of those ten also paid a $25,000 implementation fee this month, that fee stays out: it is not recurring, and adding it would overstate the total by $300,000 once multiplied by twelve.