Published
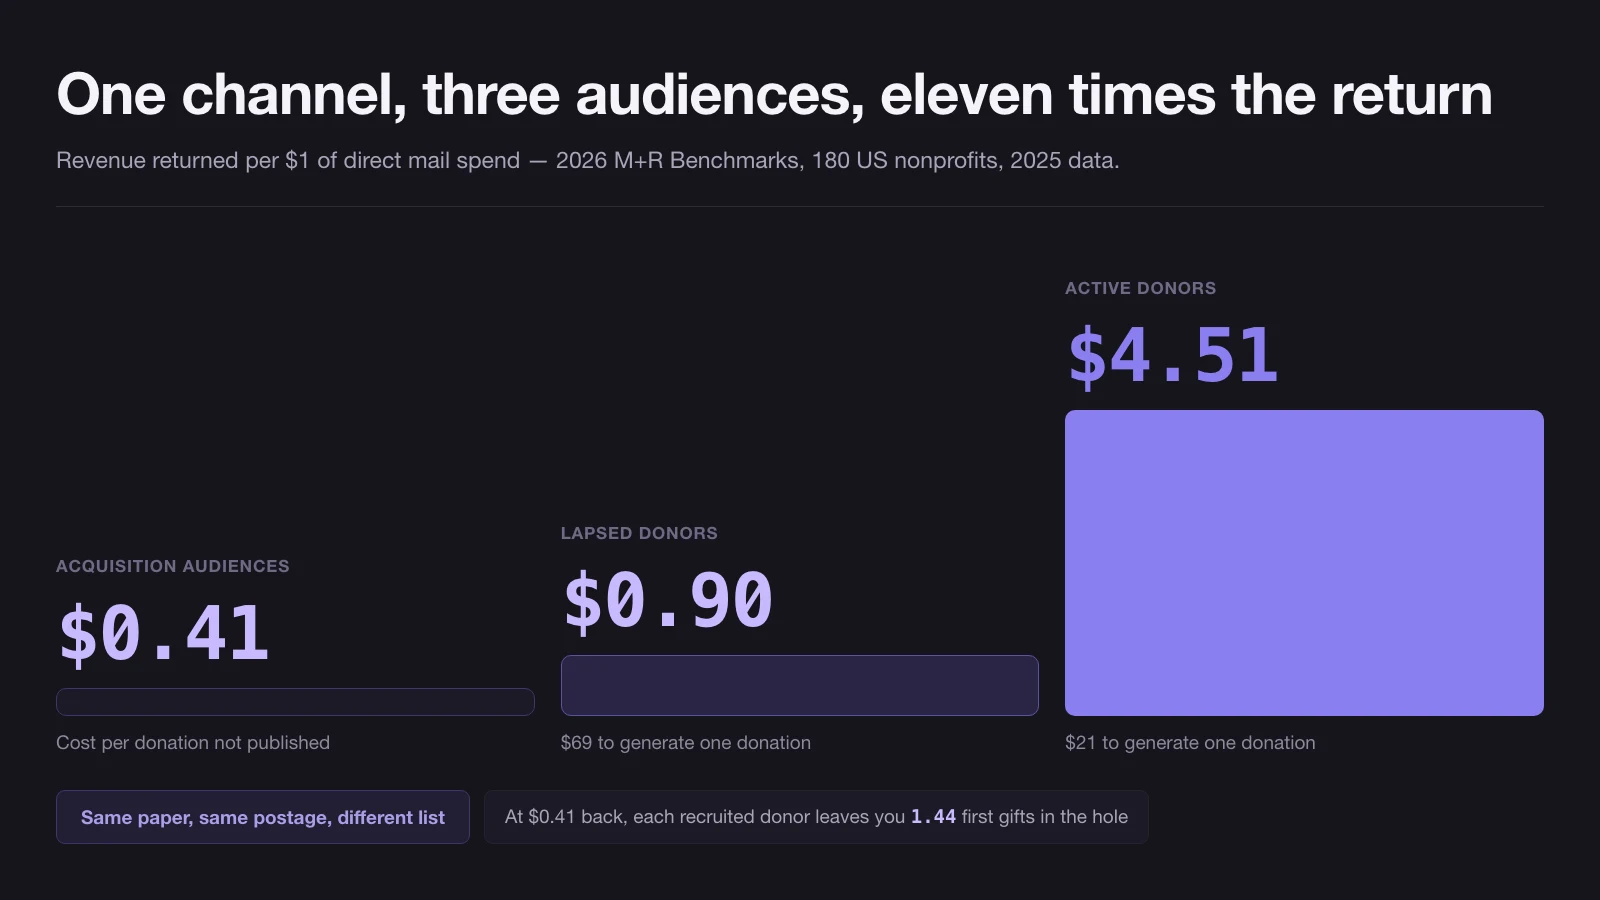
Donor acquisition runs at a loss on the first gift, and the loss is measurable: a dollar spent mailing acquisition audiences returns 41 cents, against $4.51 for a mailing to donors who already give. The first gift is a deposit. Whether it ever pays back is a separate question, and mostly an unpublished one.
How this was checked. In August 2026 we went looking for the source behind every “cost per dollar raised by channel” table in circulation, and for any modern study that prices donor acquisition. Figures below come from the 2026 M+R Benchmarks (180 US nonprofits, 2025 data), James Greenfield’s cost guidelines as published in the NSFRE Journal in 1988, the Association of Fundraising Professionals’ own 2018 guidance, the Urban Institute and Indiana University’s analysis of 126,956 Form 990 filers, the Chartered Institute of Fundraising, the New York Attorney General’s Pennies for Charity filings, and the 2017 Frost & Sullivan study of commission-based fundraising commissioned by Australia’s competition regulator. Where a number is our arithmetic on someone else’s published figures rather than a published figure itself, it says so.
What a new donor costs before the first gift clears
M+R’s 2026 Benchmarks measure the same channel against three audiences, which is the cleanest acquisition pricing anyone publishes:
| Direct mail audience | Revenue per $1 spent | Cost to generate one donation |
|---|---|---|
| Acquisition | $0.41 | not published |
| Lapsed donors | $0.90 | $69 |
| Active donors | $4.51 | $21 |
Same paper, same postage, same agency. The eleven-fold gap between the top and bottom rows is entirely a question of who is on the mailing list.
The panel matters: 180 US nonprofits that chose to participate, skewing large and digitally sophisticated, reporting on calendar 2025. M+R warns against comparing its editions year to year because the panel changes.
Now turn the $0.41 into a per-donor number. If a dollar returns 41 cents, then the spend behind each first gift is that gift divided by 0.41 — and the shortfall left over is the gift multiplied by 1.44. That ratio is the useful part, because it holds whatever your average gift is:
Acquisition mail leaves you roughly 1.44 first gifts in the hole for every donor you recruit.
Put M+R’s $120 average direct mail gift into it and $1,000 of acquisition spend buys about 3.4 new donors at $293 each, of which $120 comes straight back. That $293 is a ceiling rather than an estimate: acquisition gifts usually run smaller than the all-mail average, and a smaller first gift means more donors per thousand dollars and a lower cost each. The ratio does not move. Forty-one cents back is forty-one cents back.
Digital is priced differently and more flatteringly. M+R’s panel spent $0.10 on digital advertising for every dollar of online revenue, with return on ad spend running from $2.48 on search down to $0.04 on TikTok. Read those as media-only figures — they exclude staff, agency fees and creative, which on most campaigns can exceed the media line.
Every channel cost table in fundraising traces back to one 1988 article
If you have seen a table of cost-per-dollar-raised by fundraising method, you have seen a descendant of James Greenfield’s guidelines, first published in the NSFRE Journal in autumn 1988. NSFRE was the predecessor of the Association of Fundraising Professionals, which is how the table came to be labelled “AFP guidelines” on a thousand vendor blogs.
AFP does not publish it. The organisation’s live guidance on evaluating fundraising costs, posted in 2018, contains no table at all — it lists ten factors that move fundraising return and argues that components should be judged in organisational context rather than against universal benchmarks. The single numeric illustration it gives is that an acquisition mailing may cost $1.00 to $1.25 per dollar raised while a later mailing to the same identified donors costs about $0.20.
Three published versions, side by side:
| Activity | Greenfield, 1988 | Greenfield, 1999 book | Hallett, 2019 |
|---|---|---|---|
| Direct mail acquisition | $1.25-1.50 | $1.00-1.25 | $1.00-1.50, all acquisition methods |
| Direct mail renewal | $0.25 | $0.20 | $0.40-0.75 |
| Special and benefit events | $0.50 | $0.50 of gross | $0.50 if well managed |
| Corporate and foundation solicitation | $0.20 | $0.20 | $0.20, to $0.40 with consultants |
| Planned giving and bequests | $0.25 | $0.25 | $0.03-0.06 |
| Capital campaign and major gifts | $0.05-0.10 | $0.05-0.10 | $0.08-0.15 for personal visits |
| Whole programme | $0.20 | $0.20 | $0.20-0.25 |
Two of those columns have the same author and disagree on both direct mail rows. None of the three rests on a dataset — Greenfield’s own framing was that like institutions should be compared method against method using “reasonable cost guidelines”, with no panel or sample described. The original table has no telemarketing row at all; every version you see with one has had it added downstream.
None of this makes the numbers useless. It makes them a starting hypothesis with a 1988 date stamp, and it means an organisation that measures its own channels has better information than the benchmark it is being compared against.
What the 2026 evidence actually prices, channel by channel
Here is what carries a panel behind it today, and what does not.
| Channel or audience | Published figure | Source and panel |
|---|---|---|
| Direct mail, acquisition | $0.41 revenue per $1 | M+R 2026, 180 orgs |
| Direct mail, lapsed | $0.90 per $1, $69 per donation | M+R 2026 |
| Direct mail, active donors | $4.51 per $1, $21 per donation | M+R 2026 |
| Paid search | $2.48 return on ad spend, media only | M+R 2026 |
| Multi-format digital | $1.82 | M+R 2026 |
| Display | $1.11 | M+R 2026 |
| Peer-to-peer SMS | $0.98 | M+R 2026 |
| Digital video | $0.56 | M+R 2026 |
| Google Ad Grants | $0.17 return on ad spend, $793 per donation | M+R 2026 |
| TikTok | $0.04 return on ad spend, $590 per donation | M+R 2026 |
| Lead generation, all platforms | $2.81 per lead, $3.64 on Meta | M+R 2026 |
| $2.40 revenue per subscriber per year | M+R 2026 | |
| Whole programme, from tax filings | median $5.40 raised per $1 of fundraising expense | Urban Institute and Indiana University, 126,956 Form 990 filers |
| Peer-to-peer fundraising events, participant-led | no panelled cost figure | — |
| Face-to-face and door canvassing, US | no panelled cost figure | — |
| Galas and benefit events | no panelled figure; Hallett 2019 repeats Greenfield’s $0.50 | — |
The blanks are the finding. No vendor and no trade body publishes a cost per dollar raised for peer-to-peer, for events or for face-to-face acquisition in the United States, despite all three being sold as acquisition channels. The Chartered Institute of Fundraising runs the best-panelled face-to-face study in existence — 60 charities and 16 agencies, 685,150 UK sign-ups in 2024 producing £50 million of first-year giving — and publishes volume and value without publishing cost.
Email deserves one caveat rather than a row of its own: its headline numbers move when the measurement changes rather than when behaviour does, which we worked through in detail for open rates. Judge email acquisition on revenue per subscriber, not on the engagement metrics above it.
The Urban Institute row is the largest real dataset here and the oldest: a median of $5.40 raised per dollar of fundraising expense across 126,956 organisations, from Form 990 data for fiscal year 2000. Treat it as evidence that the spread is enormous rather than as a current benchmark.
Two more gifts, net of asking, is what an acquired donor owes you
The acquisition deficit is 1.44 first gifts. Recovering it means soliciting the donor again, and soliciting costs money too — at M+R’s active-donor economics, a dollar of renewal mail returns $4.51, so 78 cents of each renewal dollar raised is actually yours.
Divide one by the other and the payback condition is clean:
1.44 ÷ 0.78 = 1.85 further gifts, net of the cost of asking, before the acquisition is paid for.
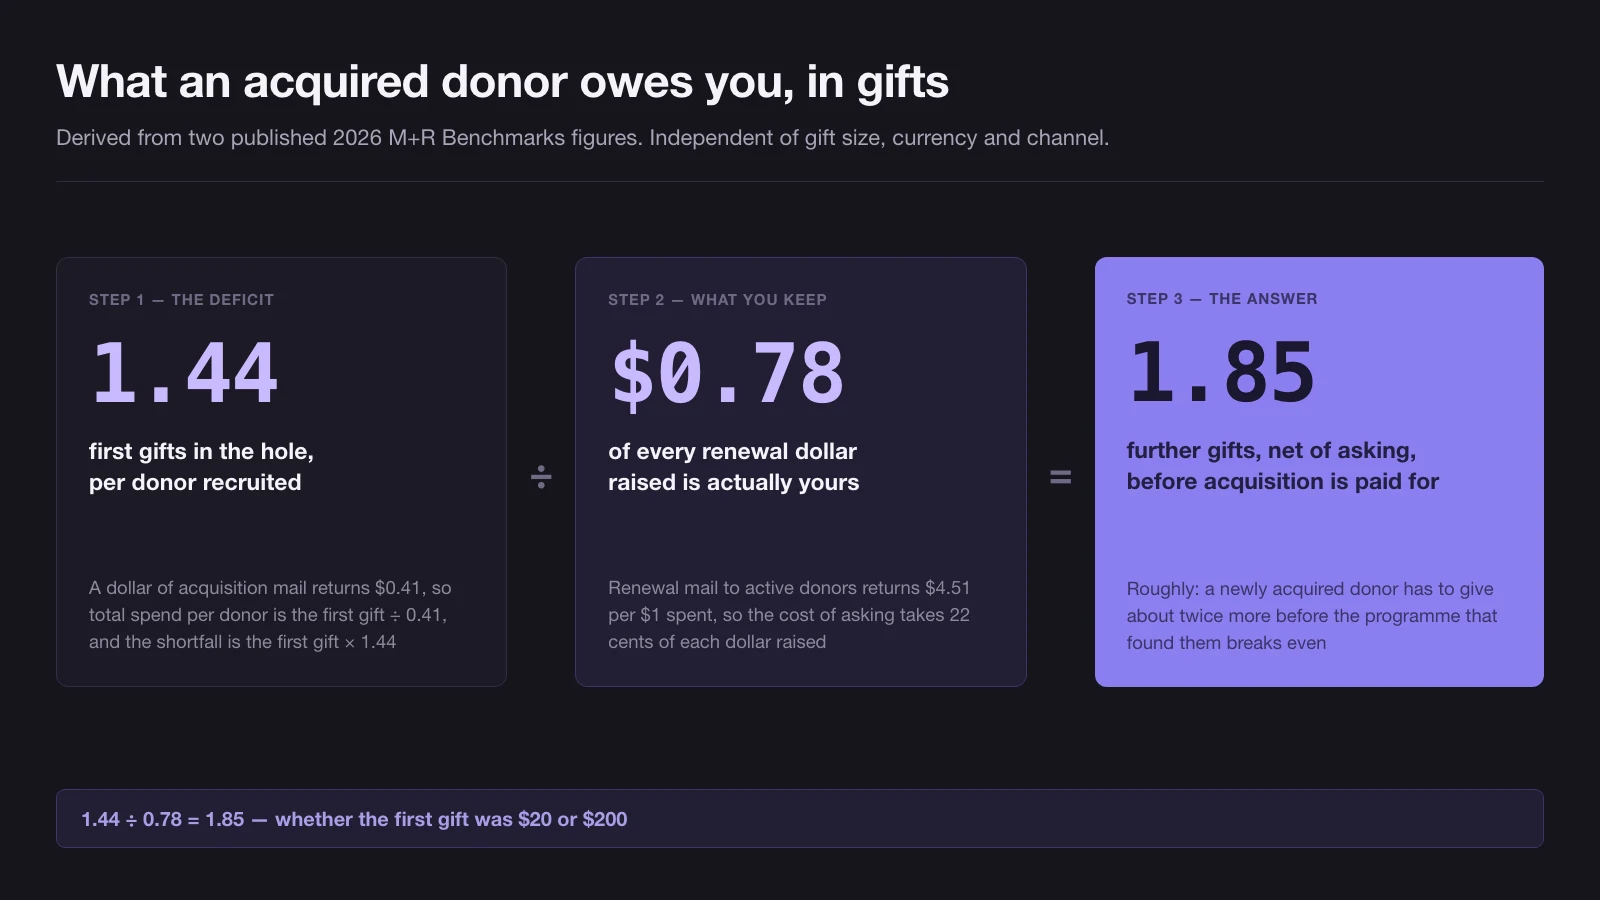
That number is independent of gift size, currency and channel, which is what makes it worth carrying around. Roughly: a newly acquired donor has to give about twice more before the programme that found them is even.
Whether they do is a retention question. M+R’s panel gave 1.3 gifts per one-time donor per year, so an acquired donor who stays a full year delivers about 1.3 of the 1.85 needed. Everything else depends on how many survive into year two and beyond.
Hold repeat-donor retention at a rate and you can solve for the first-year retention you need. Published repeat-donor figures cluster in the high fifties to low sixties on full-year measures and read considerably lower on year-to-date cuts, and the donor retention benchmarks piece explains why they differ so much between sources:
| If repeat retention is | First-year retention needed to break even |
|---|---|
| 50% | 71% |
| 60% | 57% |
| 70% | 43% |
| 80% | 28% |
| 90% | 14% |
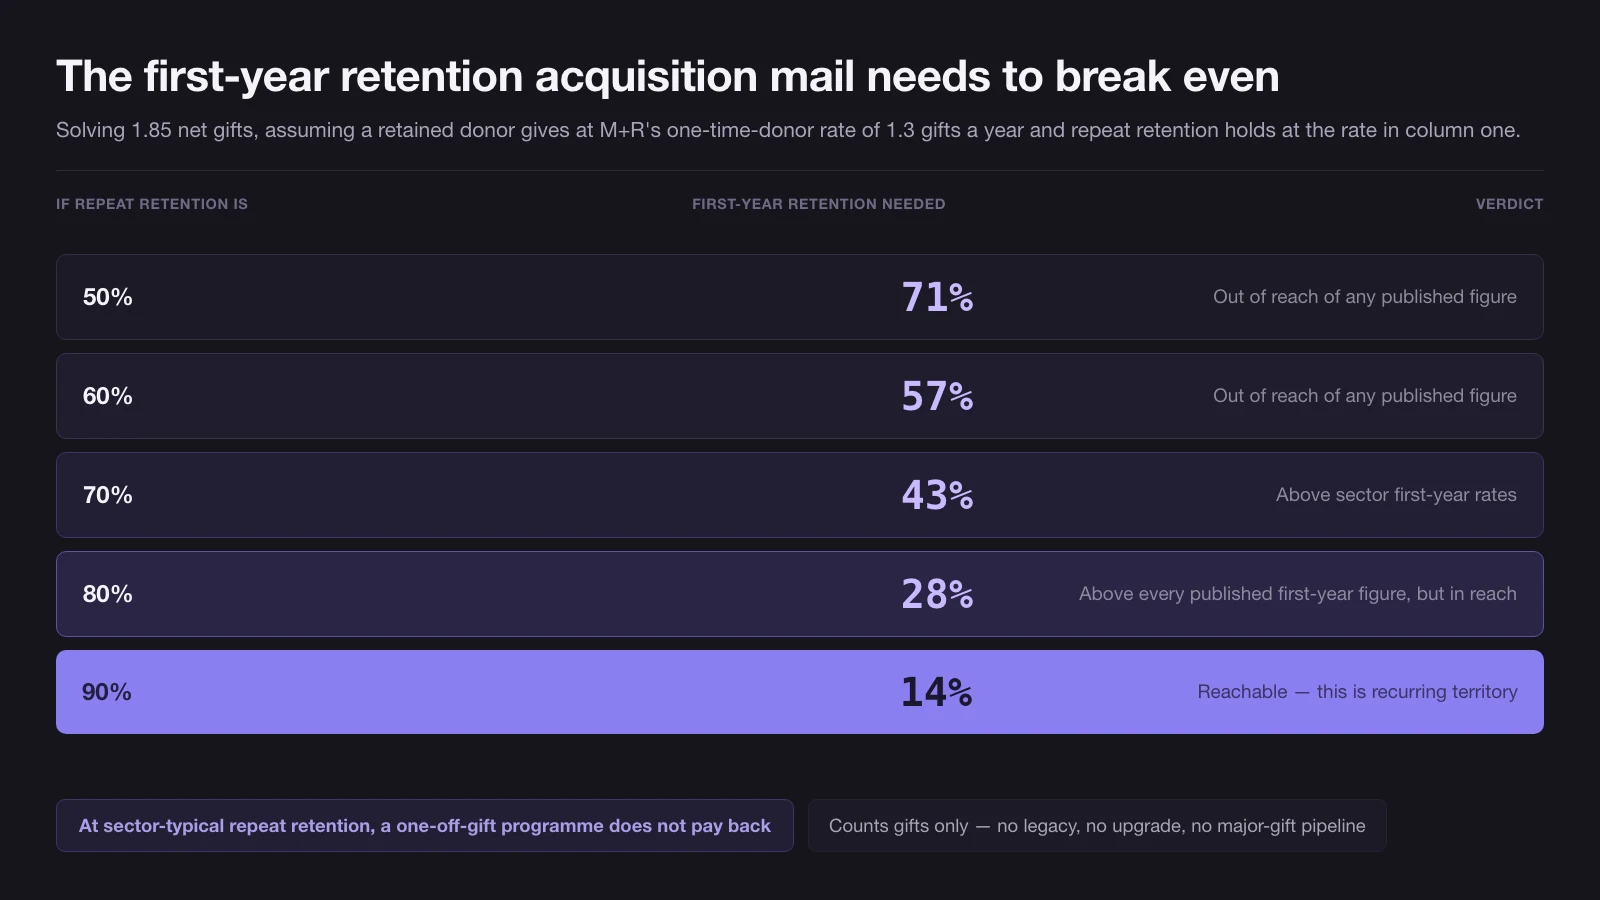
Read the second row against any published first-year retention figure and the conclusion is uncomfortable: at sector-typical repeat retention, a one-off-gift acquisition programme mailing cold audiences does not pay back. Not slowly — not at all. The cohort dies before it clears the debt.
Three ways out, and only three. Acquire more cheaply than the panel does. Hold the second gift far above sector rates. Or change what you are acquiring.
Note what this arithmetic deliberately leaves out. It counts gifts, not lifetime value — no legacy, no upgrade, no major-gift pipeline, no assumption that a donor’s gift grows. The full version of that calculation is the customer lifetime value formula with donors in place of customers, and it makes acquisition look better than the table above. It also takes years to validate, which is why the gift-count version is the one to run first.
A monthly gift changes the denominator, not the price
Recruit a monthly donor and the payback question stops being “will they give again” and becomes “how many months will they stay”. The cost of asking drops to nothing after signup, so every month of gifts is retained in full rather than at 78 cents on the dollar.
Two independent sources put the same price on it. The UK’s 2012 Hodgson review of the Charities Act reported that agency cost for face-to-face recruitment equals the value of the first 10 to 18 months of donations. A 2017 Frost & Sullivan study commissioned by Australia’s competition regulator reported agency fees of 8 to 17 times the monthly donation. Different countries, different methods, five years apart, near-identical answer: a recruited monthly donor arrives owing between eight and eighteen months of gifts.
Against that, M+R publishes the survival curve for sustainers: 10% cancel within two months, 81% are still active at seven months, 71% at twelve, and a little more than half at twenty-four.
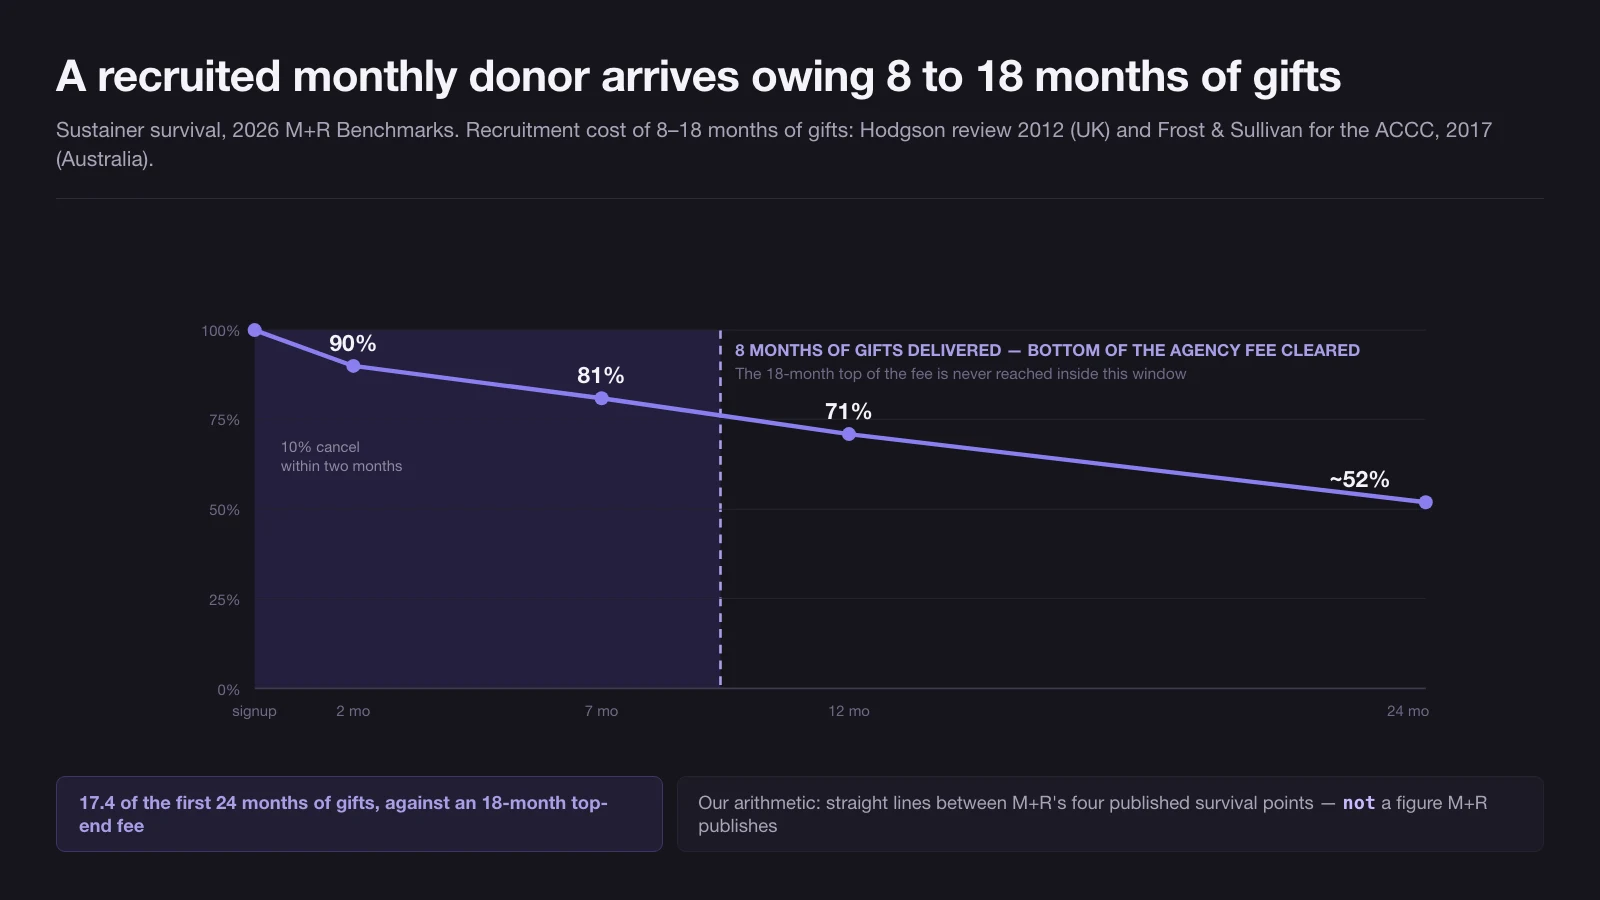
Draw straight lines between those four published points and the average recruit delivers 17.4 of the first 24 months of gifts. That is our arithmetic on M+R’s figures, not a figure M+R publishes — but it is the comparison that matters. Those 17.4 months clear the bottom of an 8-to-18-month recruitment cost somewhere around the ninth calendar month, and never clear the top of it: 17.4 months of gifts against an 18-month fee, after a full two years of waiting.
So monthly acquisition is not cheaper. It is payable. The debt is denominated in months of a gift that arrives automatically, instead of in gifts that have to be asked for and might not come. That is why recurring now carries 27% of online revenue across M+R’s panel — 22% at small organisations, 37% at the largest — and why a recurring option in front of a first-time donor is worth more than another prospecting mailing. Monthly donors also gave 0.2 additional one-time gifts each in 2025, averaging $21, on top of their subscriptions.
Expensive channel or expensive segment: the eleven-fold test
Most conversations about acquisition cost are misfiled. They start “direct mail is too expensive” when the data says something narrower.
Look at the spread inside a single channel. Direct mail returns $0.41 from acquisition audiences and $4.51 from active donors — eleven times, with nothing changing but the list. Paid search returns $2.48 and Google Ad Grants $0.17, fifteen times apart in the same format, because grant-restricted bidding reaches a different searcher. In both cases the audience explains more of the variance than the channel does.
Then look at the spread between organisations. In the Urban Institute’s Form 990 analysis, more than a quarter of organisations raised over $15 per dollar of fundraising expense, while another quarter raised under $2. Same channels available to all of them.
So the diagnostic order is: segment, then organisation, then channel. Before retiring a channel, split its results by audience temperature and check whether you are looking at a channel that costs too much or a segment that was never going to pay.
One structural warning about the ratios you will be judged on. BBB Wise Giving Alliance Standard 9 asks for no more than 35 cents of fundraising cost per dollar of related contributions. The Canada Revenue Agency treats a fundraising ratio above 35% as warranting scrutiny and above 70% as rarely acceptable. CharityWatch grades on cost to raise $100, with an A+ reserved for $0 to $4. Every one of those judges a blended, whole-programme number — which means an organisation investing heavily in acquisition looks worse on all three by construction, in the years when it is buying the donors that will make the ratio look good later.
That is not an argument for ignoring the ratios. It is an argument for knowing which year you are in. The New York Attorney General’s 2025 Pennies for Charity report, covering 588 professional fundraising campaigns run in 2024, found that half returned less than 50% to the charity and 104 of them lost money outright. Acquisition that never converts is not an investment; it is a transfer.
Deciding whether to keep buying donors at this price
Five numbers settle it, and all five come off your own file rather than off a benchmark.
- Cost per acquired donor, all-in. Media plus agency plus staff plus creative, divided by donors whose first gift cleared. Not by leads, not by names.
- First gift size for that cohort specifically. Multiply by 1.44 to see the deficit you are carrying per donor, or by 2.44 to see the total investment before anything comes back.
- Gifts per retained donor per year. M+R’s panel gave 1.3 gifts per one-time donor per year, which is what the table above assumes a retained donor also does. Below that number, the breakeven threshold rises fast.
- First-year and repeat retention, as separate figures. The blend hides which of the two is broken, and it moves for reasons that have nothing to do with either.
- Share of new donors who take a recurring option. This is the lever that converts an unpayable debt into a payable one, and it is decided in the ninety seconds around the first gift.
Run those five and the channel argument mostly resolves itself. What remains is the harder half — building acquisition that produces second gifts rather than first ones, which is the work we do with nonprofit and impact organisations.
08 / Reader questions
Frequently asked questions
01How much does it cost to acquire a new donor?
No panelled benchmark exists, and that is the honest answer. What is published is a ratio: M+R's 2026 Benchmarks put direct mail to acquisition audiences at $0.41 of revenue per dollar spent, which leaves you about 1.4 first gifts in the hole for every donor recruited. One agency, TrueSense, publishes a $90-120 range on its own blog, up from $40-50, without stating what data it rests on. No trade body publishes a sector figure.
02Is donor acquisition or retention cheaper?
Retention, by about eleven times, in the one channel where both are measured on the same panel. M+R's 2026 direct mail figures are $4.51 returned per dollar mailed to active donors against $0.41 to acquisition audiences, and the cost to generate a donation is $21 from an active donor against $69 from a lapsed one — M+R does not publish the prospect figure at all. What a point of retention is worth in cash is worked through separately in our piece on donor retention benchmarks.
03What is a good cost per dollar raised?
About $0.20 across a whole programme is the figure the sector repeats, and it comes from a 1988 practitioner article rather than a study. External judges use blended ratios instead: BBB Wise Giving Alliance Standard 9 asks charities to spend no more than 35 cents of fundraising cost per dollar of related contributions, and the Canada Revenue Agency treats a fundraising ratio above 35% as warranting scrutiny.
04What is a good donor acquisition rate?
Nobody publishes one. Donor acquisition rate is usually defined as first-time donors divided by total donors, which makes it a description of your file's mix rather than a measure of performance — it rises when you acquire well and equally when you retain badly. The nearest published shape is M+R's finding that new donors produced 31% of online revenue across its 2026 panel of 180 organisations.
05What is donor acquisition?
The work of turning someone who has never given into someone who has given once. It covers prospecting, the first ask and the first gift, and it ends the moment the gift clears — everything after that is retention. It is the only stage of the donor lifecycle that reliably loses money while it is happening.
06What is the 33% rule for nonprofits?
It is the one-third public support test in US tax law, not a fundraising cost rule. To be treated as a publicly supported charity rather than a private foundation, an organisation generally has to show that at least a third of its support comes from the public. It gets confused with the fundraising cost standards, which sit at 35%: BBB Wise Giving Alliance Standard 9 and the Canada Revenue Agency's first scrutiny threshold both use that figure.
07What are the 5 stages of donor development?
Identification, qualification, cultivation, solicitation and stewardship. Acquisition covers the first four; stewardship is where the money is actually made, because the acquisition spend is not recovered until the donor has given again. The framework is useful for sequencing work and useless for costing it, since no stage in it carries a published price.