Published
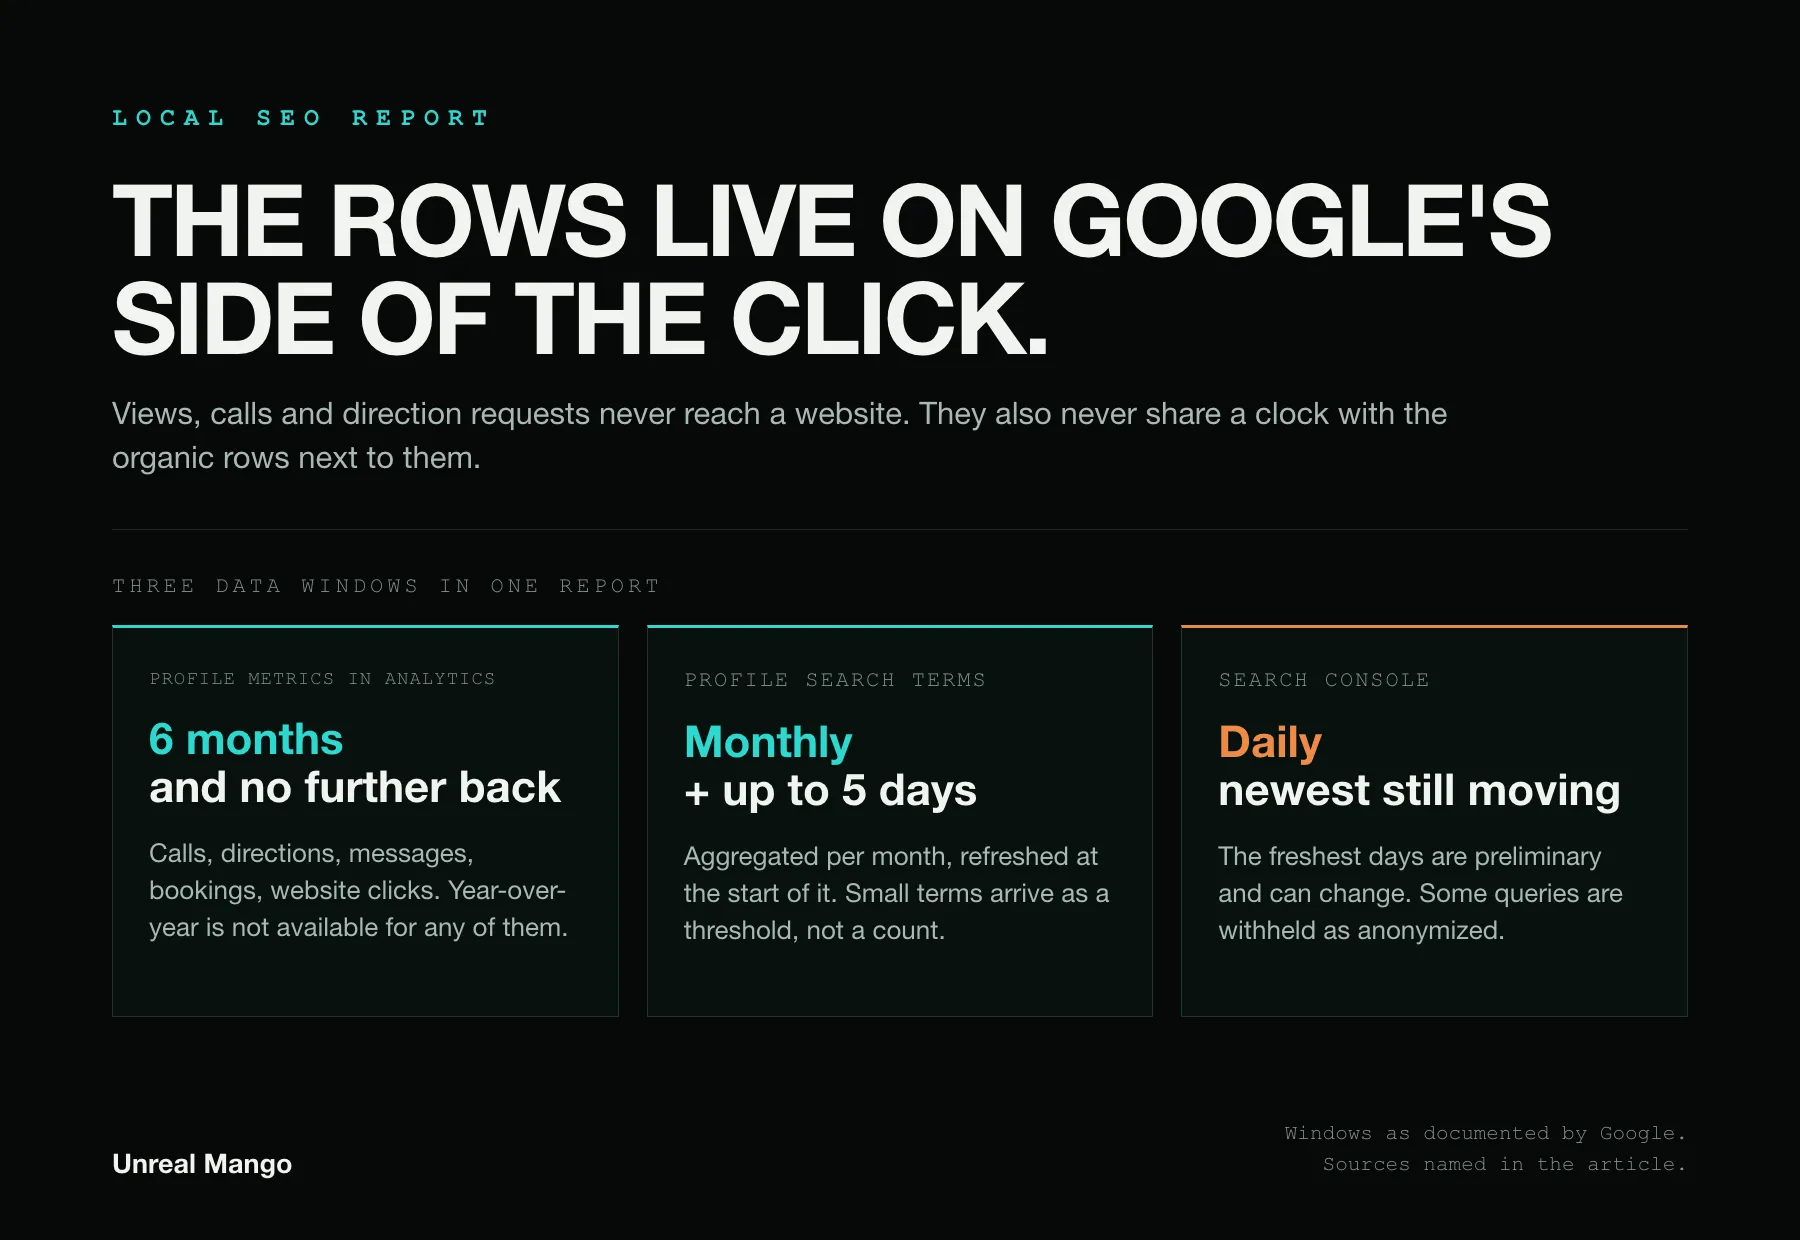
A local SEO report carries the organic rows any SEO report has, plus five that only a Google Business Profile counts: profile views, calls, direction requests, messages and bookings. Those rows run on their own clock — a six-month window, search terms refreshed once a month, and grid ranks that are snapshots rather than averages.
That last part is where most local reports quietly break. The rows get copied into the same monthly table as organic clicks, given the same date header, and compared month over month as though all of them were measured the same way. They are not, and the mismatch is documented by Google in three different places.
The four impression rows do not add up to a number of people
Google’s Business Profile Performance API publishes eleven daily metrics plus a placeholder value. All but one of them describe something that happens entirely on Google’s surface, before anyone reaches a website, and no Search Console row can substitute for them. Several of them — calls, directions, messages, bookings and menus — do reach Google Analytics, but only through the Business Profile link, and they arrive there as the profile’s own counts rather than as site-side events. The exception is website clicks: the one row where the visit itself continues onto your site.
| Report row | API metric | What Google counts |
|---|---|---|
| Profile views, Maps and Search × desktop and mobile | BUSINESS_IMPRESSIONS_DESKTOP_MAPS and three siblings | one unique user per day, separately in each of the four rows |
| Calls | CALL_CLICKS | “the number of times the business profile call button was clicked” |
| Direction requests | BUSINESS_DIRECTION_REQUESTS | route requests to the business location |
| Messages | BUSINESS_CONVERSATIONS | message conversations received on the profile |
| Bookings | BUSINESS_BOOKINGS | bookings made through Reserve with Google |
| Website clicks | WEBSITE_CLICKS | taps on the website link — the only row where the visit itself continues onto your site |
Food businesses get two more, BUSINESS_FOOD_ORDERS and BUSINESS_FOOD_MENU_CLICKS, and the menu row carries the same one-user-per-day rule as impressions. Which rows appear at all depends on where you look: the profile dashboard hides metrics that are not relevant to the business, while Google Analytics “shows every available Google Business Profile metric, regardless of your business type” — so the same profile produces two different metric lists depending on the export.
The trap is in the first line. Impressions are split four ways — Maps and Search, desktop and mobile — and each of the four is deduplicated on its own: “multiple impressions by a unique user within a single day are counted as a single impression.” One person who checks you on Maps at lunch and searches your name from a laptop that evening is one impression in each of two rows. Add the four rows into a single “total profile views” figure and that person becomes two people. The sum is a legitimate volume indicator and an illegitimate audience count, and a report that labels it “people who saw us” is wrong in a way nobody downstream can detect.
Keep the four rows separate, or sum them under a name that admits what they are — profile impressions, not visitors. Which of these belong on the front page at all is a separate question, answered by the business model rather than by the data source; the SEO KPIs that survive that filter are a shorter list than the API offers.
One viewer a day against every appearance: two counting units in one table
Search Console counts an impression each time your site appeared in results — deduplicated across multiple results for the same query, but never by person. The profile counts a unique viewer once per day, and its directions metric is counted as unique requests too — Google’s note on the change says the count now accounts for multiple taps, direction request cancellation and spam.
So the two halves of a local report use different units for what looks like the same idea:
- Search Console impressions answer how often our site showed up.
- Profile views answer how many different people looked at the profile, once each, per surface, per day.
Neither is wrong. Putting them in adjacent columns under one heading called “visibility” is. The practical rule for the document: label every row with its source and its unit, and never compute a ratio across the two — a “profile view to click rate” mixes a once-per-day person with an appearance that was never deduplicated by person at all, and produces a number that cannot be interpreted in either direction.
There is a second asymmetry worth printing once in the appendix. Of the seven profile metrics that cross into a linked Analytics property, views is not one of them. The demand-side row — the one that shows whether people are finding the business at all — does not exist in the analytics export, so a report built only from analytics is missing the top of the local funnel by construction.
The three data windows a local report has to reconcile
This is the part that has no equivalent in organic reporting, and the reason a local report cannot simply inherit an organic template.
Three sources, three windows:
- Profile metrics read through the Google Analytics link — six months. Google’s Analytics help is explicit: “Google Business Profile metrics are available for the last 6 months. Reports in Google Analytics can only display data within this period, even if your selected Google Analytics date range is longer.” Read that way, a year-over-year row is available for organic clicks and unavailable for calls and direction requests. The Performance API documents no history limit of its own, and the profile-side performance help documents none either — which is a reason to treat the per-location export as the archive rather than the dashboard: an undocumented window is not a guaranteed one. Not hard to work around — export monthly and keep your own archive — but impossible to reconstruct after the fact, which is why the first month of a local engagement should start the export.
- Profile search terms — monthly, plus a settling period. Google states that the searches metric “is updated at the start of each month” and that “it might take up to 5 days to show up.” A report produced on the 3rd of the month either has no search-term row for the month that just closed, or has one that is still filling in.
- Search Console — daily, with the newest days provisional. “The newest data can be preliminary, meaning it’s still being collected and might change in the next few hours.”
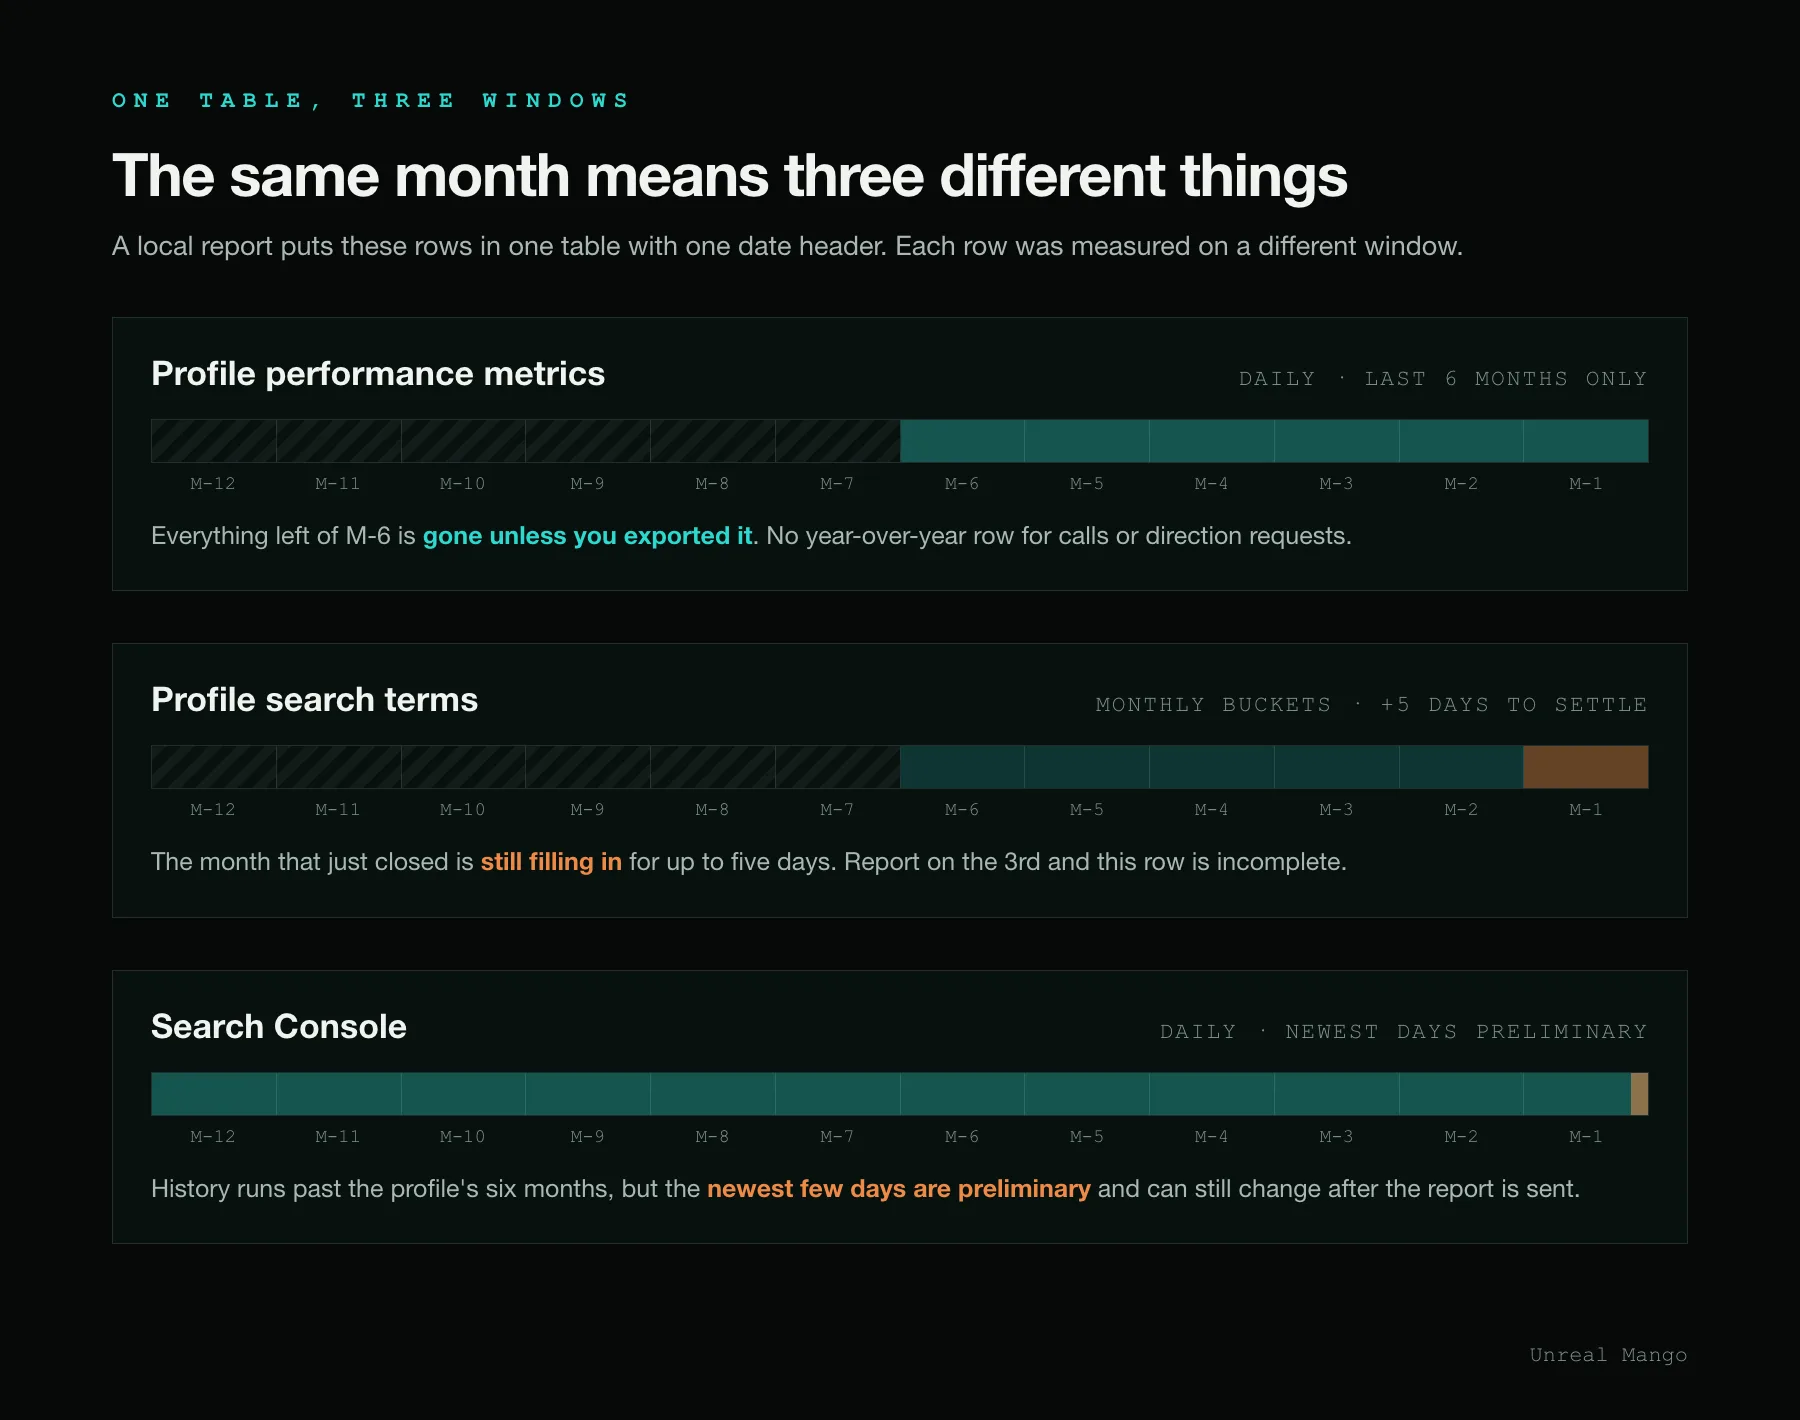
One consequence for the document: when a client asks why the search-term list changed after they read the report, the answer is a documented refresh rather than an error — but only if the report said which window each row came from, and on which day it was pulled, in the first place.
One thing these windows do not explain is the gap between the month work was done and the month it shows up in the numbers; that lag belongs to search itself rather than to the reporting stack, and an SEO report for clients has to handle it with a separate column. The windows above are narrower and more fixable: they are properties of the export, and stating them removes an argument rather than starting one.
Profile search terms come monthly, and the small ones come back as a threshold
Both query lists in a local report have holes, and the holes are different shapes.
On the profile side, the search-keywords endpoint returns impressions “aggregated on a monthly basis”, and each value comes back as one of two things: an actual number, or a threshold — documented as “the threshold below which the actual value falls.” Google’s prose calls these impressions; the field definition calls the actual value “the sum of the number of unique users that used the keyword in a month” — one more deduplicated-person row that cannot sit next to a Search Console query count. A term used by a handful of people does not arrive as a count at all — it arrives as a ceiling Google chose, and no amount of exporting will turn that ceiling into a number.
On the Search Console side, the omission is a different mechanism with the same effect: “some queries are omitted from the report to protect user privacy. These are called anonymized queries.”
The reporting consequences are concrete:
- A profile search-terms table cannot be summed. Adding rows whose values are thresholds produces a total that is not the number of searches and not a lower bound anyone can state precisely.
- The long tail of a local profile is structurally invisible, so “we now rank for 40 new terms” is a claim about the terms large enough to be printed, not about the tail.
- The two query lists will disagree on brand versus category share, because they are censored by different rules. Report them side by side, or report one — not a merged list.
The honest version of this row is a ranked list of the terms Google did put a number against, a count of the rows that came back as thresholds, and a one-line note saying that both lists are incomplete by design.
A grid rank is a snapshot at a coordinate, not an average position
Local position is not a number. It is a function of where the person searching is standing, and Google says so plainly: distance “refers to how far each business is from the customer who’s searching”, alongside relevance and prominence, and “there’s no way to request or pay for a better local ranking on Google.”
That single sentence is why grid tools exist. A grid check runs the same query from a set of coordinates laid out around the business and records the rank at each one, producing a field of pins rather than a number. It is a snapshot: one query, one coordinate, one moment.
Average position in Search Console is the opposite kind of object — an average across every impression the query produced, over the whole date range, from wherever those searchers happened to be. The two cannot be compared, averaged together, or plotted on the same axis.
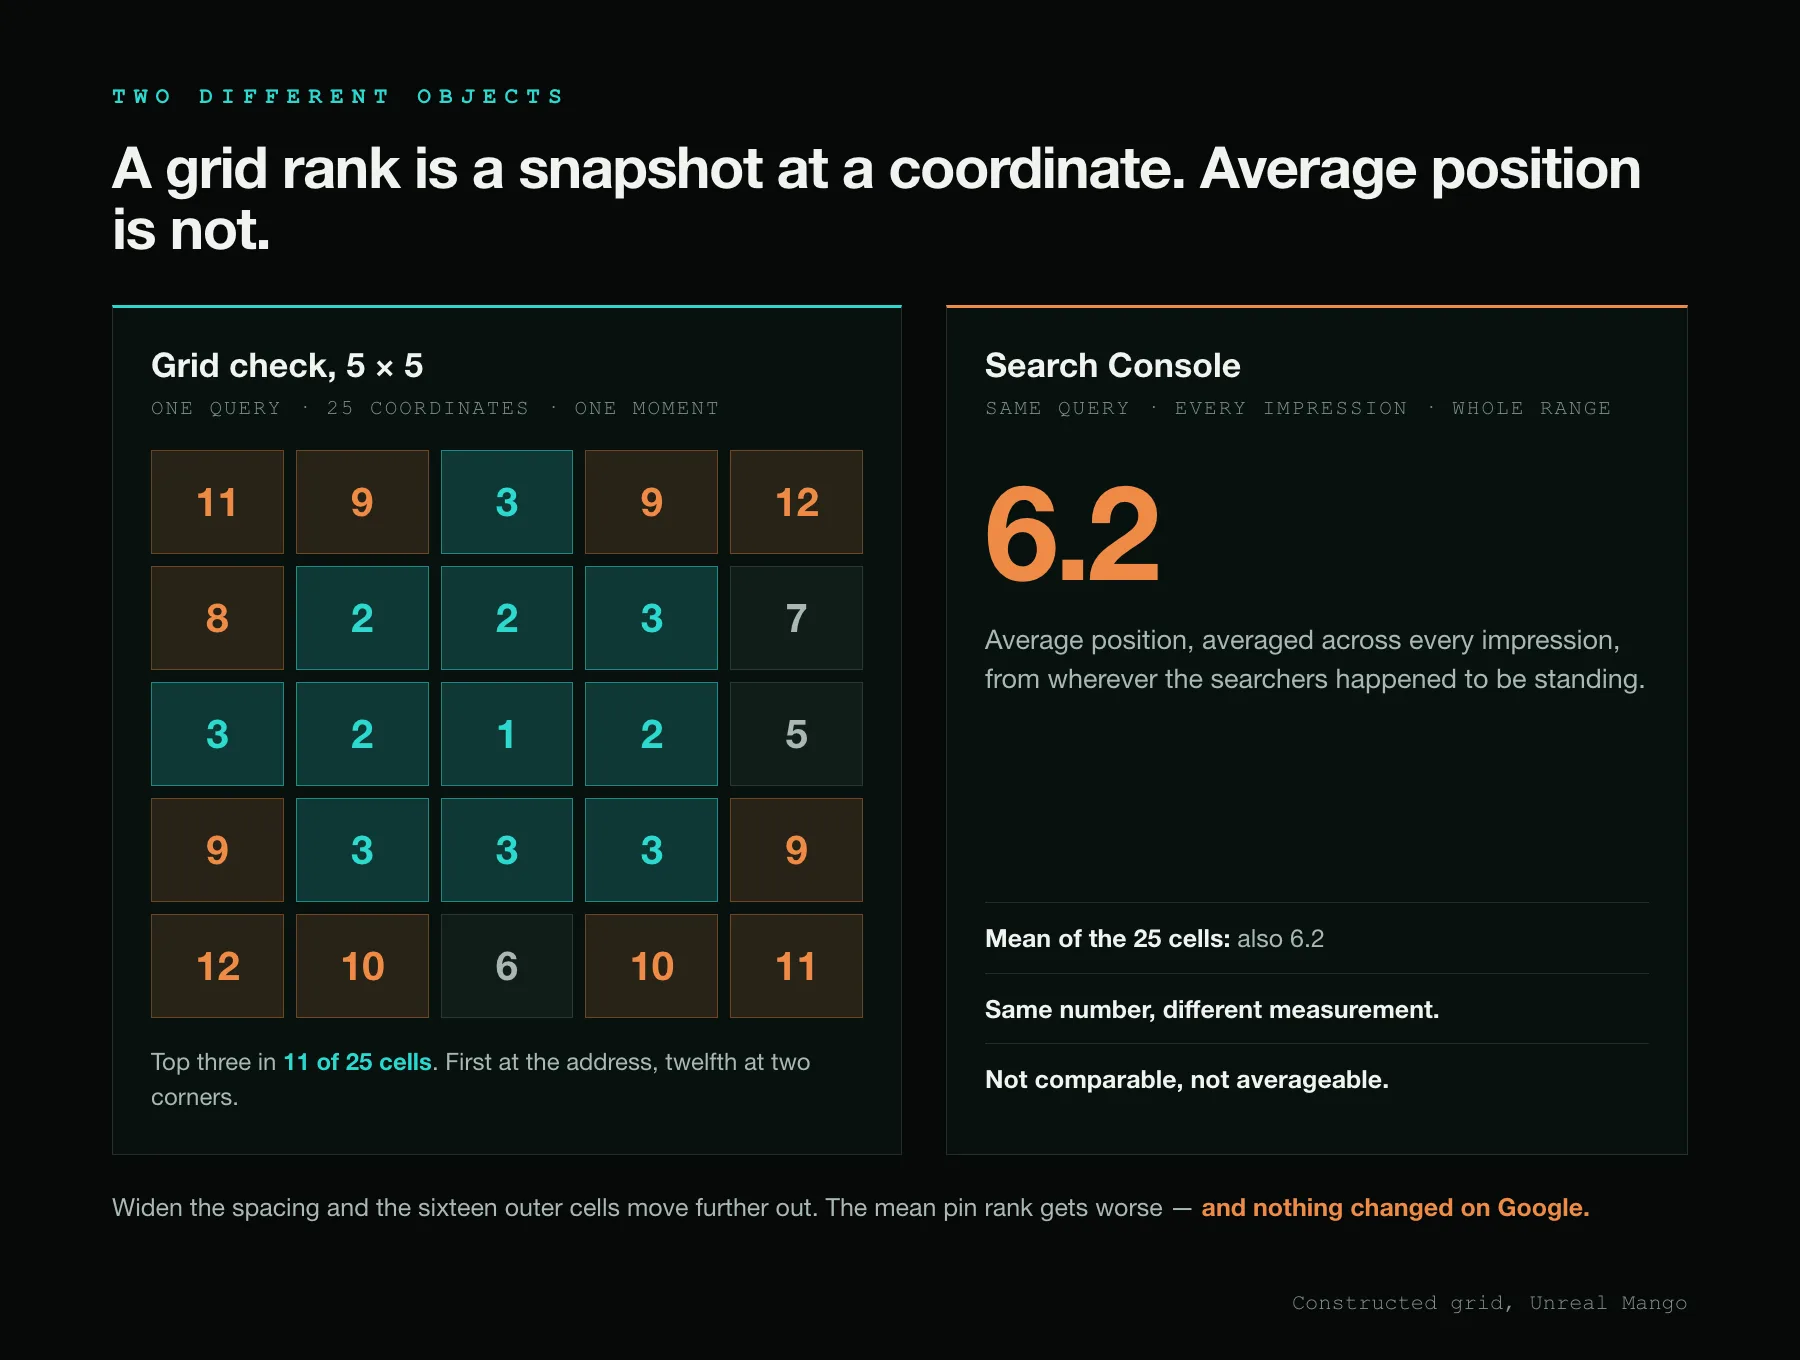
The reporting failure specific to grids is that the instrument is adjustable and the adjustment is invisible in the output. Take a 5 × 5 grid: the distance from edge to edge is four times the spacing, so half-mile spacing covers two miles across and one-mile spacing covers four. Widen the spacing between two reports and the sixteen cells of the outer ring now sit further from the business than they did last month. Ranks at those cells get worse, the mean pin rank rises, and nothing has changed on Google at all.
Three rules keep the row honest:
- Freeze the centre, the spacing and the grid size, and print all three next to the number. A grid metric without its parameters is not reproducible.
- Report the shape, not just the mean. In the constructed grid above, “top three in 11 of 25 cells” carries the information that a mean pin rank of 6.2 destroys — that business is first at its own address and twelfth at two of the corners, and only the cell count shows it.
- Run the check at a comparable time. A snapshot taken at 9am on a Tuesday and one taken at 8pm on a Saturday are two different measurements of a moving surface.
Review rows a report can carry: counts, averages, answered share, reply time
Reviews belong in a local report as measurements, which is a different job from the tactics of getting them. The profile’s review data supplies exactly two figures directly — a total review count and an average star rating on a one-to-five scale — plus a creation timestamp on every individual review and a last-modified timestamp on every reply.
Everything else that belongs in the report is derived by you:
| Row | Where it comes from | Watch for |
|---|---|---|
| New reviews this period | count of reviews with a creation time inside the window | the profile’s total can fall between reports when reviews are removed |
| Average rating, all time | the profile’s own average | moves slowly once the base is large |
| Average rating, this period | computed from the period’s reviews only | the row that actually shows a change in service |
| Answered share | replies present ÷ reviews received | replies added late land in the wrong period unless you date them |
| Time to reply | the reply’s last-modified timestamp minus the review’s creation time | the reply carries only a last-modified timestamp, so editing a reply inflates the gap; a median beats a mean either way |
Answered share and time to reply exist only because the underlying data carries timestamps rather than counts. No dashboard hands them over as a tile, which is precisely why they are worth carrying: they measure something the business controls completely.
The all-time average is the row most likely to be misread. On a profile with 400 reviews, a month of straight fives moves the average by a rounding error, and a client who sees a flat 4.6 for three months concludes that nothing is working. Print the period average next to it, or the report is telling a true story badly.
One location or ten: what the aggregate row hides
Multi-location reporting is where the plumbing decides the story. If the profiles are read through the Google Analytics integration, Google’s help states the limit outright: “if multiple Google Business Profiles are linked, you won’t be able to segment or filter GBP metrics by an individual Business Profile(s).” One aggregate, no per-location breakdown.
That is a reporting decision disguised as a configuration detail, because an aggregate hides exactly the failure a local programme most needs to catch. Take a constructed but ordinary case: eight locations, direction requests up from 3,270 to 3,465 across the group, a headline of +6%. Inside that total, seven locations are up between 8% and 11%, and one — the store whose profile was suspended for a fortnight — is down 40%, losing 96 requests while the other seven gained 291. The group row is green. The only location that needs attention this month is the one the group row erased.
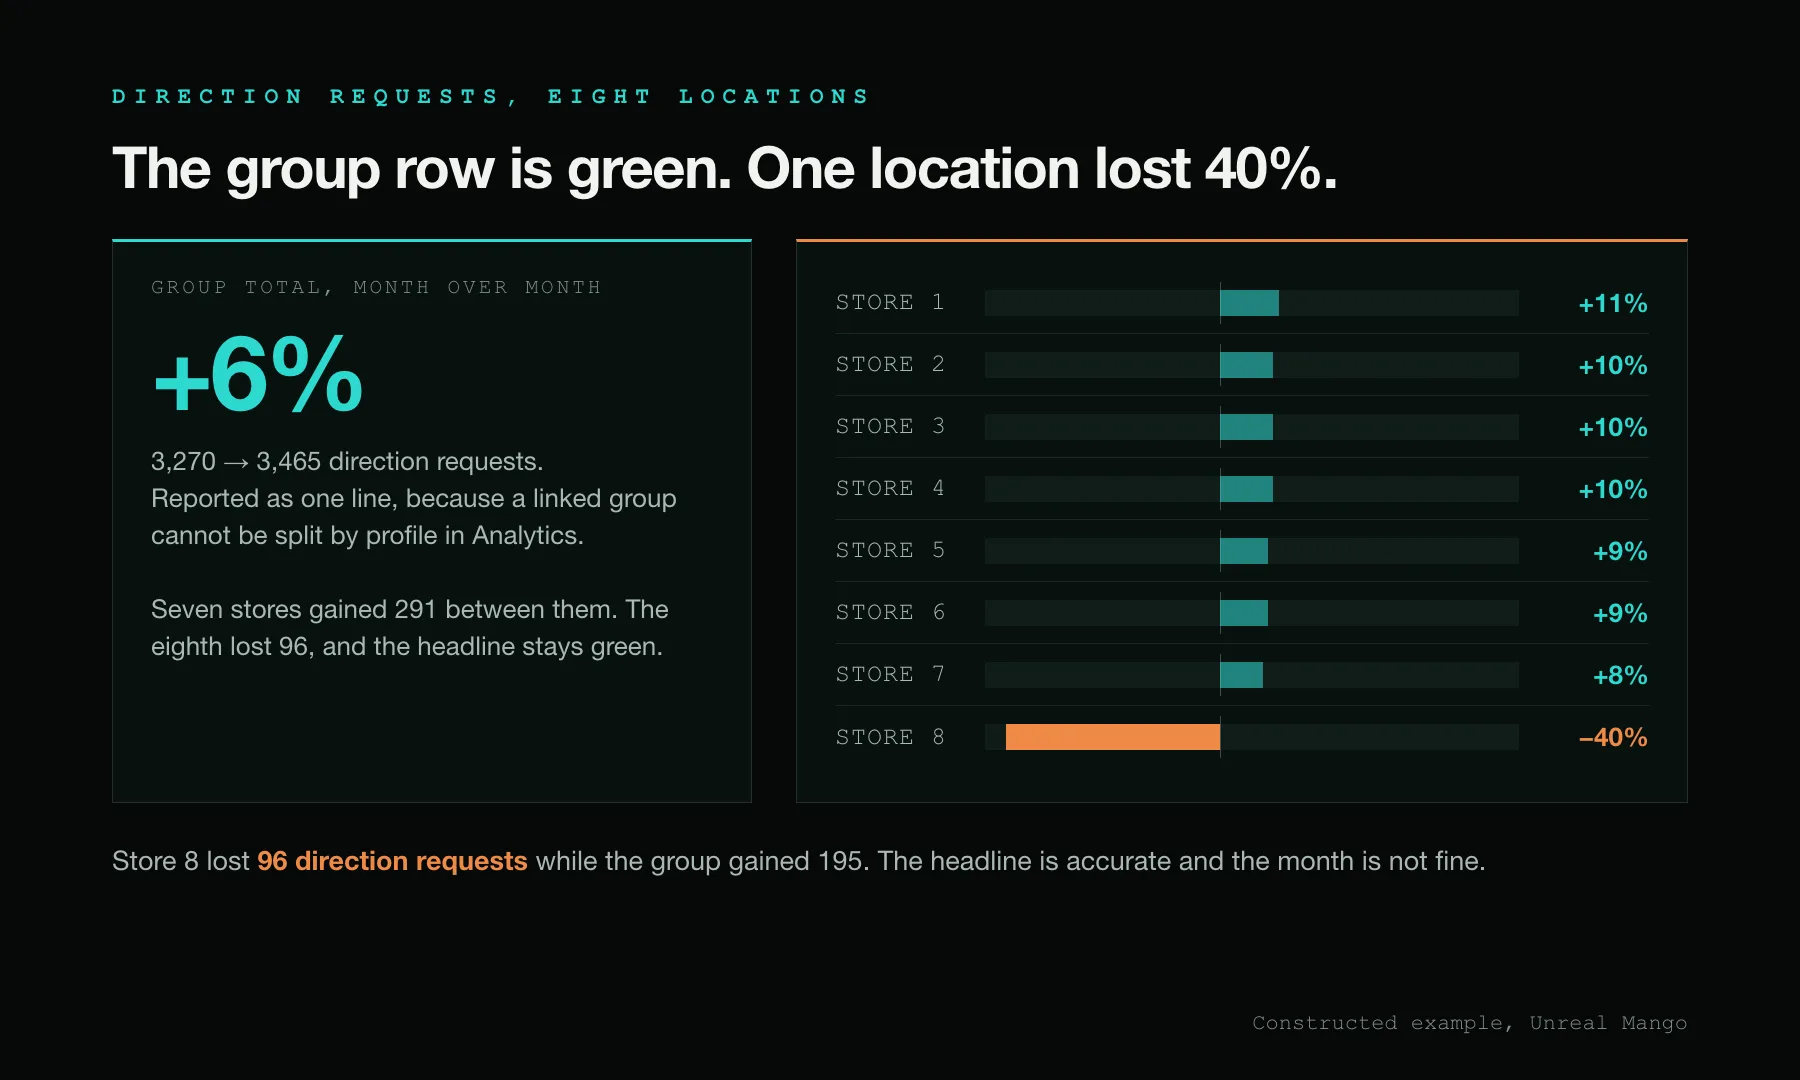
So per-location rows come from the Performance API or from per-profile exports, and the aggregate exists only as a headline. Three rows make the difference visible without turning the report into a spreadsheet: the group total, the best and worst location by percentage change, and a count of locations below their own previous period — the row that catches a single failing site inside a growing group.
The settings to freeze before next month’s local report
None of the above requires better tools. It requires the report to state what it measured, so that the next edition measures the same thing. Six settings do most of the work:
- The pull date, after the search-term refresh has settled rather than on the 1st.
- The date window for each source, written per row rather than once in the header.
- The grid centre, spacing and size, printed beside the pin numbers.
- The profiles included in any aggregate, by name, and whether it can be broken out at all.
- The review snapshot date, since counts move retroactively when reviews are removed.
- The source and unit of every row — Google-side or site-side, once-per-day person or raw appearance.
A local report built this way is longer to specify and shorter to argue about. The rows that live on Google’s side of the click are the ones a local business actually converts on, and they are the rows most likely to be quietly wrong, because nothing downstream — no analytics property, no ad platform, no CRM — can contradict them. That is the whole case for writing the method down next to the numbers, and it is the part of our SEO work that clients notice second and value first.
09 / Reader questions
Frequently asked questions
01What should a local SEO report include that an organic SEO report does not?
Five rows Search Console has no equivalent for: profile views on Search and Maps, calls, direction requests, messages and bookings, all counted on Google's own surface. Add grid ranks for the map pack and a review block. Everything else — clicks, impressions, queries, landing pages — is the report you already run.
02Can I get a free local SEO report?
Yes, but a free scan only produces the rows a stranger can see from outside: current ranks, listing consistency, visible review counts and on-page checks. The profile-owned rows — views, calls, direction requests, messages, bookings — need access to the Business Profile itself, so no external tool can fill them in without it.
03How far back does Google Business Profile performance data go?
Six months once it is read through Google Analytics. Google's Analytics help states that Business Profile metrics are available for the last 6 months and that reports in Google Analytics cannot display data outside that period even when a longer date range is selected. A year-over-year comparison is therefore routine for organic rows and impossible for profile rows read through that link. Google documents no history limit on the Performance API, but it documents no guarantee either — so export monthly and keep your own archive.
04Why do Business Profile numbers never match Google Analytics?
Because they count different events in different units. The profile counts interactions that finish on Google — a call button tap, a direction request — and counts a viewer once per day. Analytics counts sessions on your site. Seven profile metrics do cross into Analytics when the profile is linked — interactions, website clicks, calls, directions, messages, bookings and menus — but they arrive on the profile's clock and in the profile's units, and views are not on that list at all.
05Is a grid rank the same as average position in Search Console?
No. A grid rank is one query run from one coordinate at one moment, so it answers where you rank standing on that particular street corner. Average position is averaged across every impression a query produced. Changing the grid spacing moves the average pin rank without anything changing on Google.
06Why do this month's local rankings look different from last month's?
Check the grid before you check the rankings. Distance is a documented local ranking factor, so widening the spacing or moving the centre pulls in cells further from the business and pushes the average pin rank up on its own. Freeze the centre, spacing and grid size, and print all three in the report.
07Where do the review numbers in a local SEO report come from?
From the profile's own review data: a total review count, an average star rating on a one-to-five scale, and timestamps on every review and reply. Answered share and reply time are not metrics Google publishes — you derive them by comparing each review's creation time against the time its reply was last modified — the only reply timestamp the API publishes.