Published
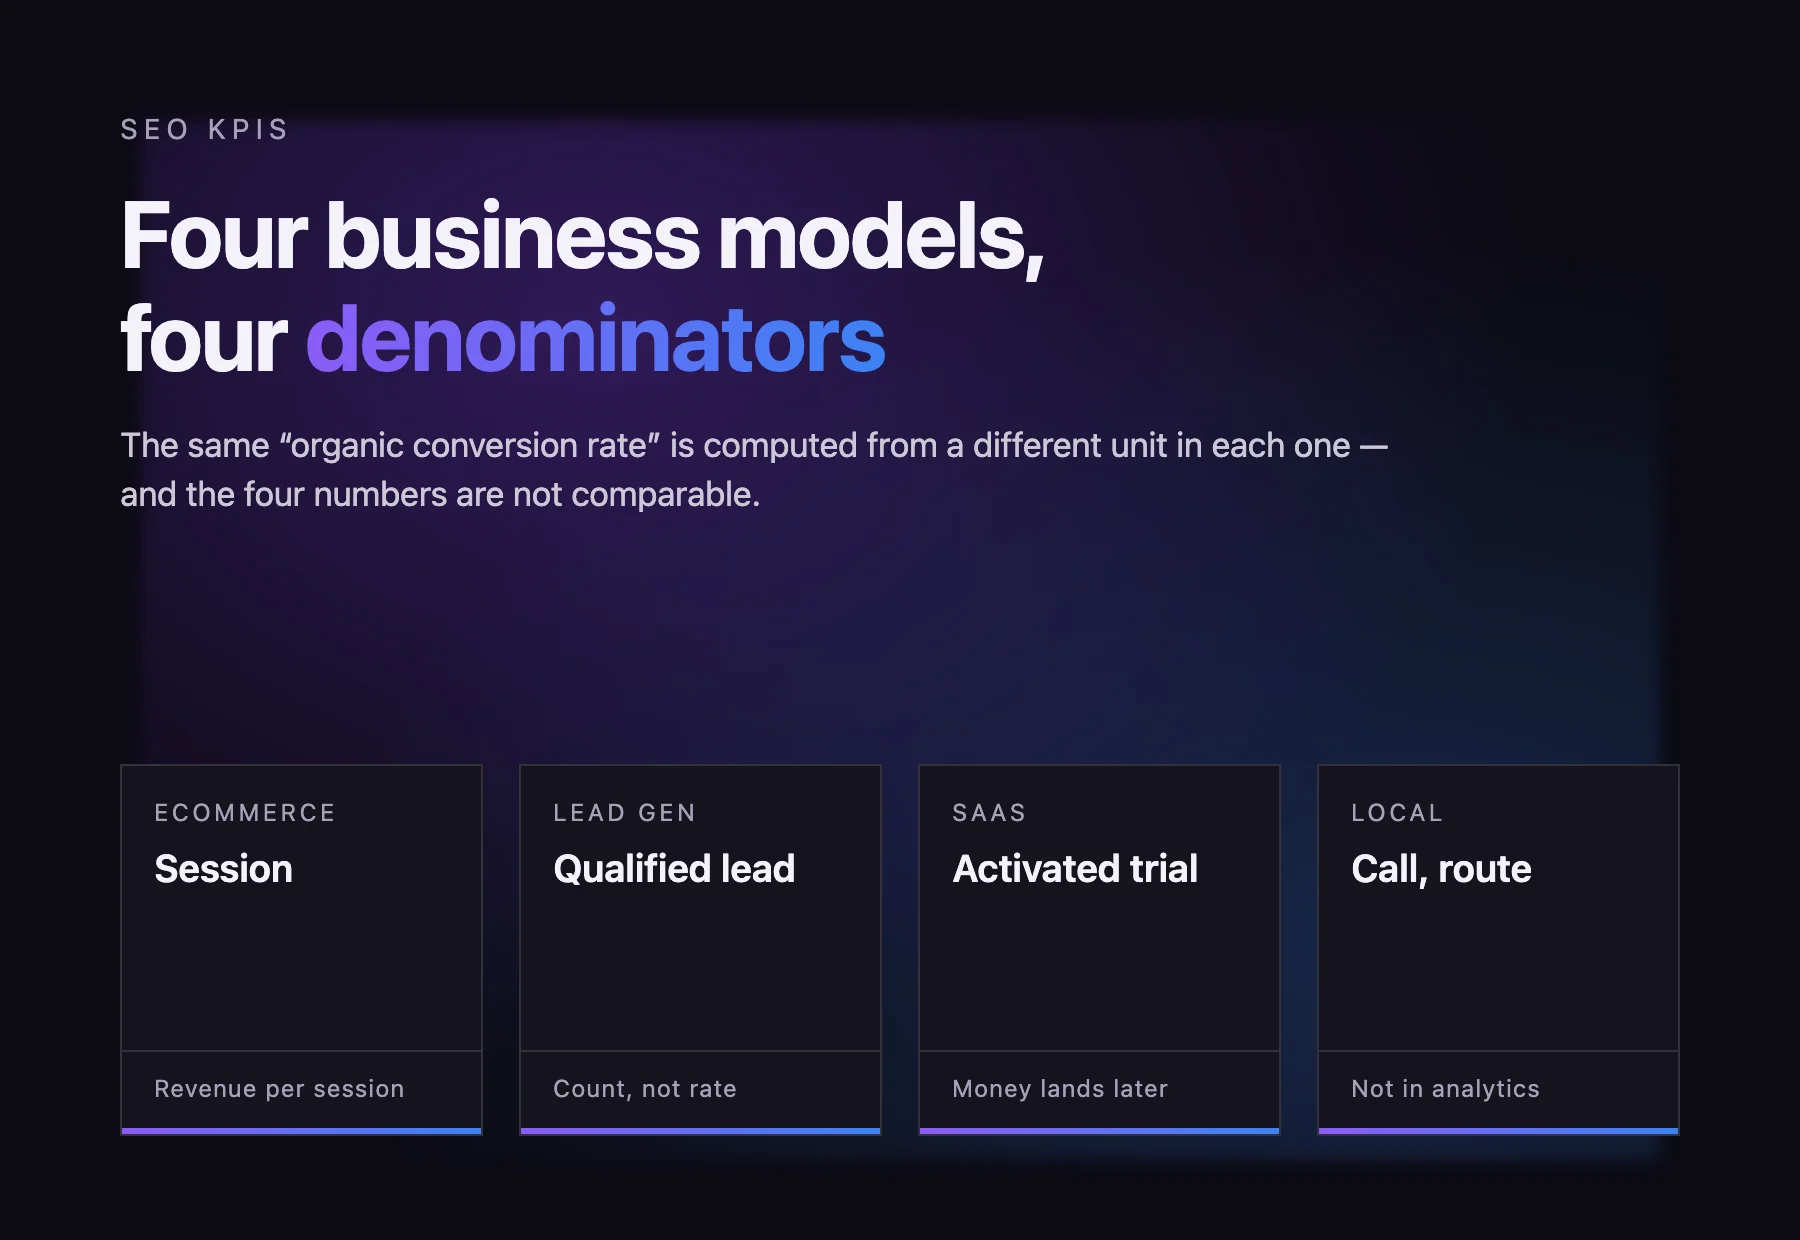
Choosing SEO KPIs is a question about your business model, not about SEO. An ecommerce store measures organic performance per session, a lead-gen business per qualified lead, a SaaS company per activated trial, a local business per call and route request. The same phrase — “organic conversion rate” — is computed from four different denominators, and the four numbers are not comparable.
That is the first half of the problem. The second half is volume: a KPI only becomes readable once enough events have accumulated behind it, and the threshold turns out to be around 100 conversion events per period, almost regardless of what your conversion rate is. Below that, the percentage moves on noise, and every meeting spent explaining the movement is a meeting wasted.
An SEO KPI is a metric someone has agreed to act on
Every SEO tool will hand you a hundred numbers. Almost none of them are KPIs.
A metric is any quantity the stack can produce: impressions, crawl depth, average position, referring domains, time on page. A KPI is the small subset that someone has committed to act on, with the action named in advance. The test is a sentence, written before the reporting period starts: if this number moves by X in this direction, we will do Y. A number with no such sentence attached is a diagnostic, and diagnostics belong in the appendix rather than on the dashboard.
This distinction does more work than it looks like it does. It is what stops a KPI list from growing to twenty items, and it is the reason two of the most-quoted SEO numbers — average position and total backlinks — usually fail to qualify: nobody can say what they would actually do differently at 14.2 versus 12.8.
The denominator moves with the business model, and the KPI moves with it
Search delivers the same thing to every site: a person who typed something. What differs is the unit that person turns into, and that unit is the denominator of every rate you will report.
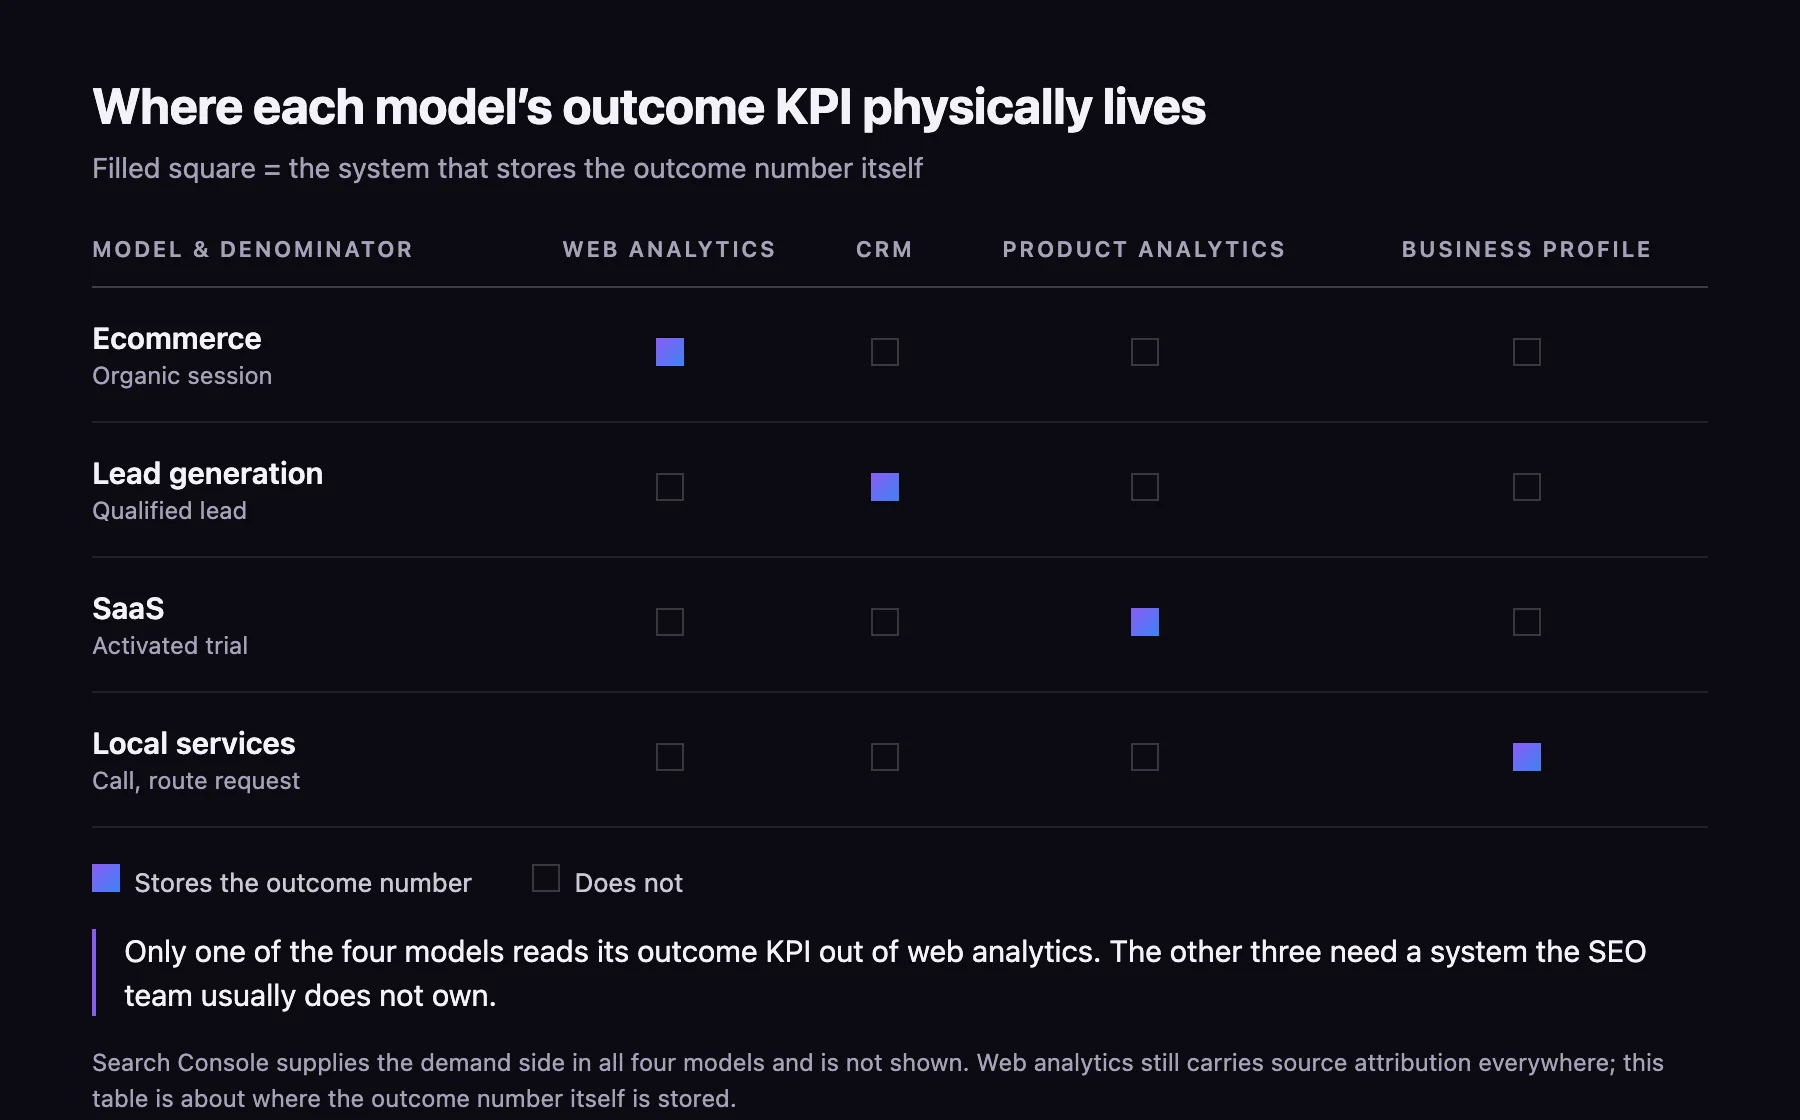
| Business model | Denominator | The KPI that carries the money | Where the number lives |
|---|---|---|---|
| Ecommerce | Organic session | Revenue per organic session | Web analytics |
| Lead generation | Qualified lead | Count of qualified leads from organic | CRM |
| SaaS | Activated trial or signup | Organic-sourced activations | Product analytics |
| Local services | Call or route request | Calls and direction requests from search | Business Profile performance data |
Read the fourth column before the third. Only one of the four models — ecommerce — reads its outcome KPI out of web analytics. The other three store it somewhere the SEO team usually does not own: a CRM, a product analytics tool, or Google’s own Business Profile data. That constraint decides more KPI lists than any best-practice article does.
Ecommerce: sessions in the denominator, and enough of them to be believed
For a store, the organic session is the natural unit. Traffic arrives, some of it buys, and both halves of the fraction come from the same system, in the same window, with the same definition. Of the four models this is the cleanest measurement setup, and it is why almost every generic SEO KPI list is implicitly written for it.
The KPI to put at the top is revenue from organic sessions, and the rate to put beside it is revenue per organic session rather than conversion rate alone — a conversion rate that rises while the average order value falls is not good news, and one number hides what the pair reveals. Two qualifiers keep it honest. First, the split by device, because organic traffic mixes desktop and mobile in proportions that shift month to month and drag the blended rate with them. Second, the window: sessions and orders must be counted over the same days, or you will be dividing October’s orders by September’s traffic.
Store benchmarks by industry are a separate question with its own arithmetic, and we cover them in a dedicated piece on average ecommerce conversion rates by industry. For KPI selection, the relevant point is narrower: comparing your rate to an industry row tells you very little, while comparing this month’s rate to last month’s tells you nothing at all unless the volume test in the next section passes.
Lead generation: the qualified lead is the denominator, the form fill is not
This is where most SEO KPI lists break, because they count form submissions and call them conversions.
A lead-gen business does not sell form fills. If organic delivers 200 submissions and 12 of them are real prospects, while paid delivers 60 submissions and 20 real prospects, the channel that looks more than three times better on the dashboard is the worse channel. The denominator has to be the qualified lead, which means the CRM is part of the measurement stack and the handoff definitions have to be agreed on before the first report. What separates a marketing qualified lead from a sales qualified one, and how to compute the rate between them without fooling yourself, is a whole subject in itself — we set it out in the piece on MQL vs SQL.
Two structural problems come with the model. The first is that a large share of lead-gen conversions never happen in the browser: the prospect calls, replies to an email, or turns up months later through a channel nobody tagged. The second is volume. A business producing 10 qualified leads a month from organic will need roughly ten months to accumulate enough events for a rate to stabilise — which is an argument for making the count, not the rate, the reported KPI.
That is not a workaround. Counts are readable at low volume in a way rates are not: 12 qualified leads is 12 qualified leads, while “6% qualification rate” on 200 submissions is a number with a very wide interval around it.
SaaS: organic gets credit for the trial, the money lands two quarters later
SaaS is the model where the KPI and the revenue are furthest apart in time.
Organic search influences the top of the funnel — a signup, a trial, a demo request. The revenue that follows appears over months, and the largest part of it may appear as expansion inside accounts that converted long ago. Choosing SEO KPIs here means splitting the chain in two and measuring each half in its own currency.
The near half is countable now: organic-sourced signups, and the share of them that reach the activation event your product defines. The far half belongs to the finance side of the business — annual recurring revenue for the contracted base, and net revenue retention for what happens to it afterwards. Neither of those is an SEO KPI, and the mistake is to claim them as one. What SEO can defensibly own is the cohort: signups that arrived through organic, tracked forward, compared against signups from every other source.
The reason to bother with the cohort split is that channels produce genuinely different customers. If organic signups activate at a different rate than paid signups, the two channels are not interchangeable at any price, and a KPI set that reports only signup counts will never show it.
Local: the best KPIs never reach Google Analytics
For a local business, the most valuable outcomes of organic search happen before anyone reaches the website.
Google’s Business Profile performance data exposes metrics that no web analytics property can see, because the interaction ends on Google’s surface: CALL_CLICKS (taps on the call button), BUSINESS_DIRECTION_REQUESTS (route requests to the location), BUSINESS_CONVERSATIONS (message conversations received), BUSINESS_BOOKINGS (reservations made through Reserve with Google), and impressions split four ways across Search and Maps on desktop and mobile. WEBSITE_CLICKS is in there too — and for many local businesses it is the least important of the set.
So a local KPI sheet built only from analytics sessions is measuring the leftovers. The set that matches the model is: calls and direction requests as the outcome pair, profile impressions on Maps and Search as the demand signal, and review volume and rating as the standing that gets you into the pack at all. On the last one, how many Google reviews you need to reach the local pack varies enough by category that it is worth checking your own before setting a target.
One warning specific to this model. Direction requests and calls are counted as button taps, not as visits or conversations — the person who taps and never arrives is in the number. Treat them as demand signals with a known upward bias, not as bookings.
About 100 conversions, whatever the conversion rate happens to be
Now the second half of the problem, and the part missing from every one of those lists: how much data a KPI needs before it is worth reading.
Take a conversion rate. The 95% interval around an observed rate depends on both the rate and the number of observations, but if you ask a different question — how many observations do I need before this percentage is accurate to within ±20% of itself — something useful falls out. The sessions required change enormously with the conversion rate. The number of conversions required barely changes at all.
| Conversion rate | Sessions needed per period | Conversions in that window |
|---|---|---|
| 0.5% | 19,300 | 97 |
| 1% | 9,600 | 96 |
| 2% | 4,750 | 95 |
| 3% | 3,140 | 94 |
| 5% | 1,840 | 92 |
| 10% | 870 | 87 |
| 20% | 390 | 78 |
| 30% | 230 | 69 |
Method: Wilson score interval at 95% confidence, solved for a relative half-width of 20% at each baseline rate. Sessions rounded up to the next 10, conversions derived from them.
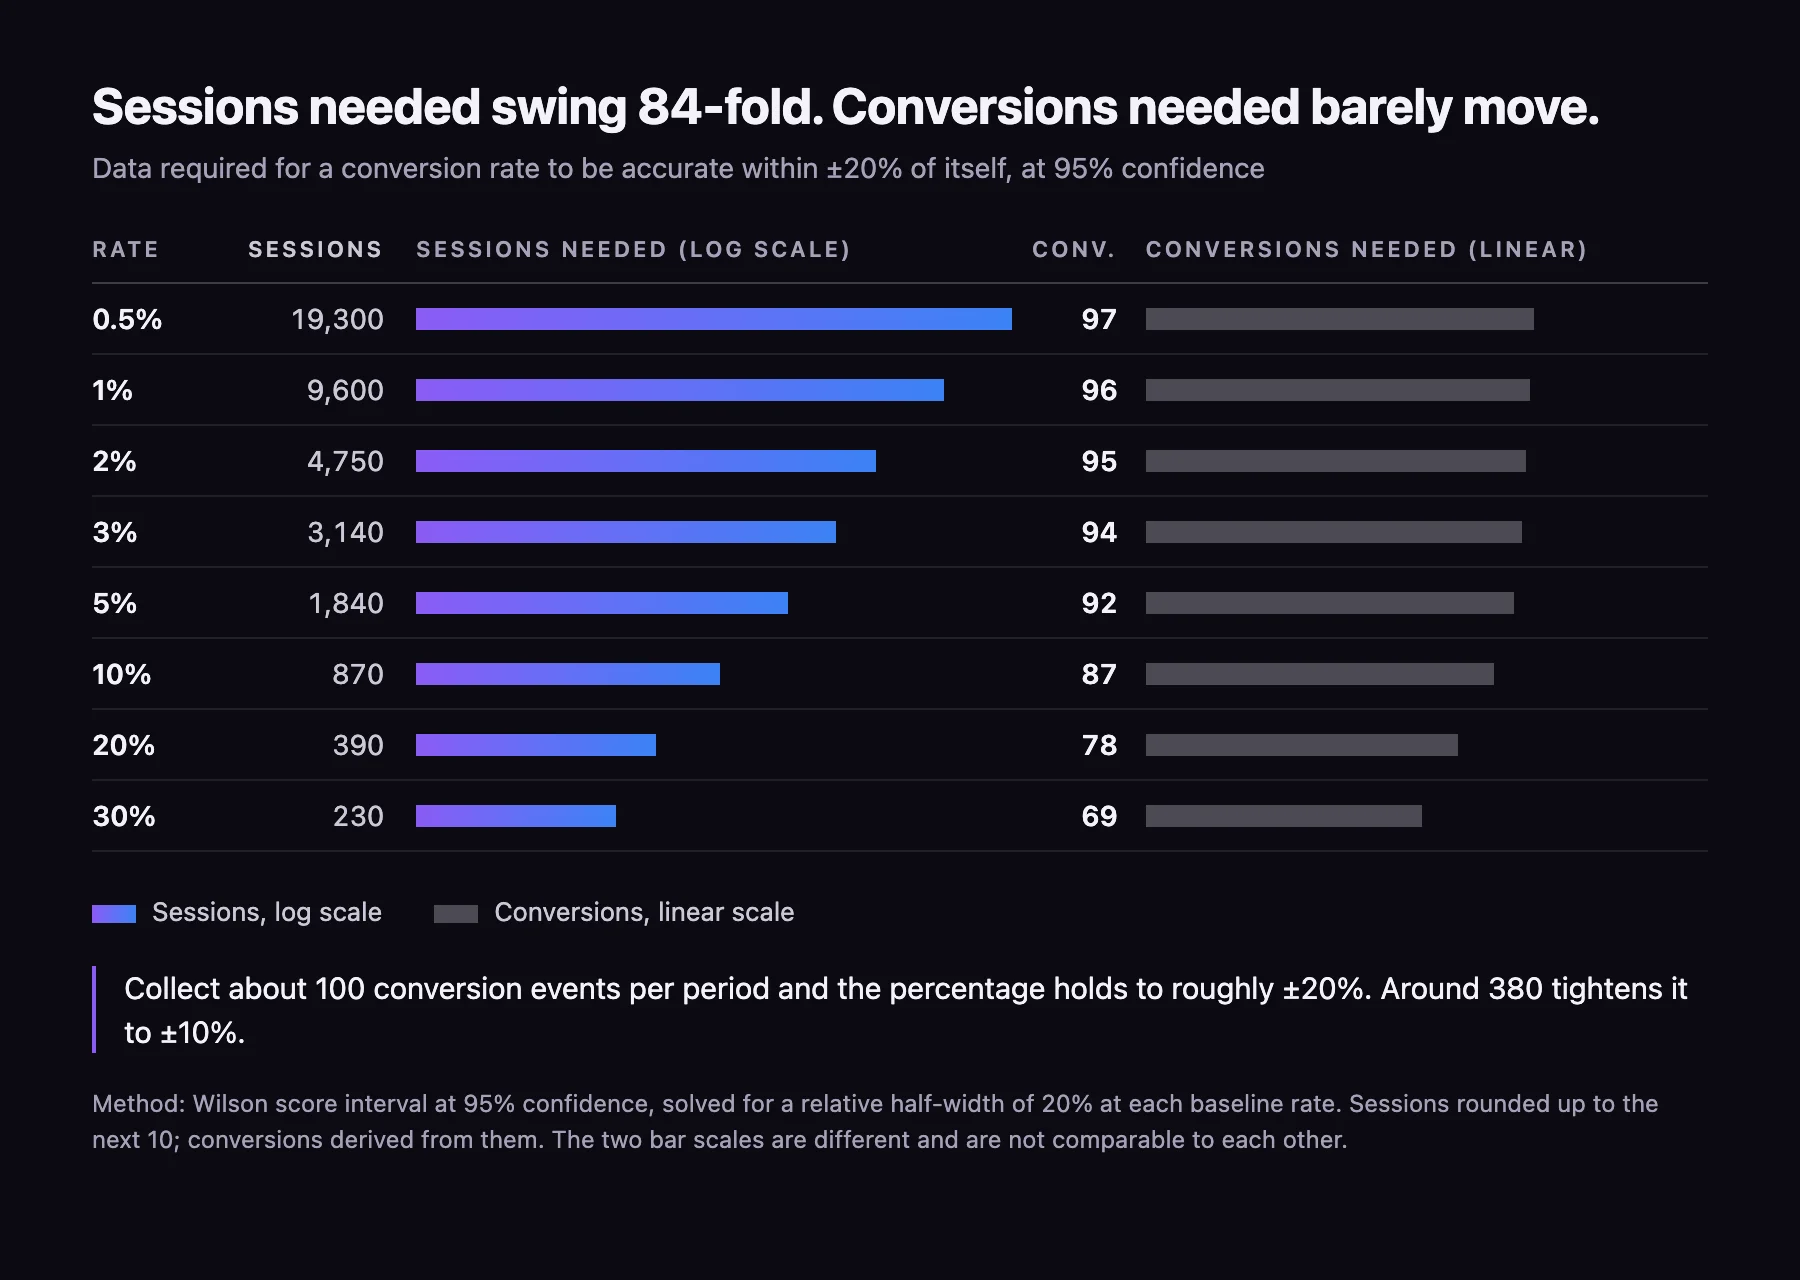
The sessions column spans 84-fold. The conversions column spans 1.4-fold, and across the range that matters for most sites — anything converting at or under 10% — it sits between 87 and 97. That is the practical rule: collect about 100 conversion events per reporting period, and the percentage you report is accurate to roughly ±20%. Collect around 380 and it tightens to ±10%. Below 100, you are reporting noise with a decimal point on it.
What that looks like on a real number is worth seeing, because the gap between the reported figure and what it actually licenses you to say is larger than most people expect:
| Sessions | Conversions | Reported rate | 95% interval | Half-width vs the rate |
|---|---|---|---|---|
| 200 | 4 | 2.00% | 0.78% – 5.03% | ±106% |
| 500 | 10 | 2.00% | 1.09% – 3.64% | ±64% |
| 1,000 | 20 | 2.00% | 1.30% – 3.07% | ±44% |
| 5,000 | 100 | 2.00% | 1.65% – 2.43% | ±20% |
The Wilson interval is asymmetric, so the last column is not a symmetric band around the reported figure — it is the half-width divided by the rate, given as a single number for comparison. The interval column carries the actual bounds.
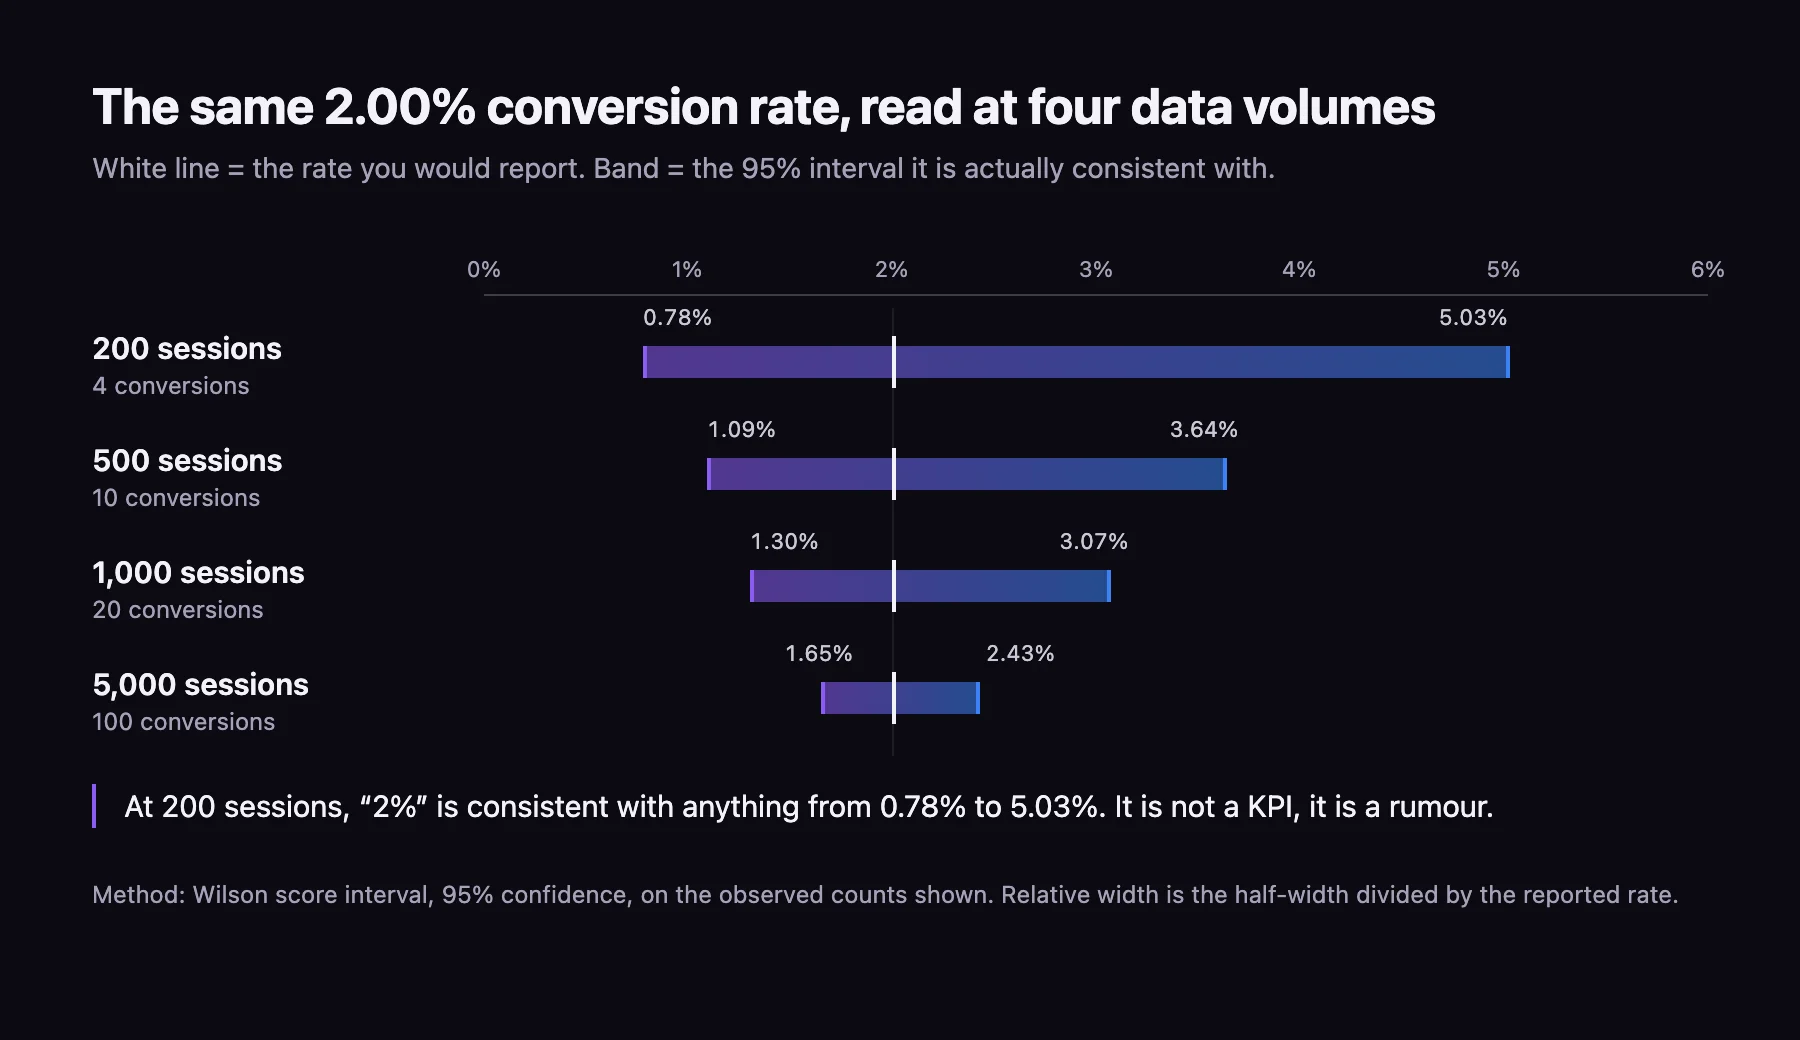
A 2% conversion rate on 200 sessions is consistent with anything from 0.78% to 5.03%. It is not a KPI; it is a rumour. The same arithmetic applies to click-through rate: 3% measured on 200 impressions sits somewhere between 1.38% and 6.39%, so a page “underperforming on CTR” at that volume has not demonstrated anything.
Two boundaries on this rule. It concerns the precision of one number — asking whether two numbers differ, which is what an experiment does, needs a different and larger calculation, set out in our piece on A/B test sample size. And it is about volume of data, not the passage of time; how long organic takes to produce results at all is a separate question, covered in the article on how long SEO takes to work.
The consequence for KPI selection is direct. If your organic channel produces 15 conversions a month, a monthly conversion rate cannot be one of your KPIs — not because rates are bad, but because that one will not hold still. Report the count monthly, and the rate quarterly or rolling.
Average position is an average of the wrong thing
Rankings survive on KPI lists mostly through habit, and the way Search Console computes position is a good reason to demote them.
Start with what the number is. Google’s documentation defines the reported position as the topmost position your property occupies, not the mean of every result you have. Its own worked example: a query returning your property at positions 2, 4 and 6 counts as position 2; a second query returning it at 3, 5 and 9 counts as 3; the average across the two is 2.5. The three lower placements contribute nothing.
Then the aggregation changes the answer again. Google states plainly that “impressions, clicks, position, and click-through-rate are calculated differently when grouping results by page rather than by property” — so the same query that reads as one number at property level appears as several separate rows, each with its own position, once you group by page. A site-wide average position layers a third effect on top: it spans every query you appear for, weighted by impressions, which means it moves when your query mix changes and nothing about your rankings does.
There are two further limits worth knowing before anyone builds a KPI on ranking data. The Search Analytics API returns at most 25,000 rows per request against a default of 1,000, and Google says outright that it “does not guarantee to return all data rows but rather top ones” — so query-level totals will not reconcile with site totals. Rare queries are filtered out entirely for privacy, and they are exactly the long tail a growing site accumulates.
Position is still useful, filtered to a named query and a named page, where it tells you whether a specific piece of work landed. As a single site-wide KPI it mostly measures which queries happened to gain impressions this month.
A KPI your stack cannot measure is a wish
Before a metric goes on the list, one question decides it: which system produces this number, and does anyone own that system?
This eliminates candidates faster than any other filter. A local business without call tracking cannot report calls-from-organic, only calls in total. A lead-gen business whose CRM does not carry the original source cannot report qualified leads by channel, no matter how good the SEO work is. A SaaS company without an activation event defined in the product cannot report activation, and defining one is a product decision, not a marketing one.
Two structural gaps deserve naming because they affect the data itself, not just the reporting. Browser-side measurement loses events to consent choices, blockers and cookie lifetimes, which is one motivation for moving collection server-side. And retention windows are finite: Google Analytics 4 keeps user-level and event-level data for 2 or 14 months on standard properties, with longer options only on the 360 tier, while Search Console holds 16 months. If your KPI needs a two-year comparison, the comparison has to be exported and stored before the window closes, or it will simply not exist when you go looking.
The honest move, when a KPI cannot be measured, is to write down what would have to change to make it measurable and pick a proxy in the meantime — not to keep the unmeasurable one on the slide with a dash next to it.
How many SEO KPIs to keep, and the test that settles it
The lists currently ranking for this query offer ten, twelve, thirteen and twenty-one items — counted from their own titles in August 2026. The right number is smaller, and it is set by a constraint that has nothing to do with SEO: how many numbers can actually change a decision inside one reporting cycle.
Most teams review organic performance monthly and can act on perhaps one or two findings between reviews. A KPI set larger than the number of decisions the team can make is not a measurement system, it is a wall. Three to five is the working range, chosen so that each one maps to a distinct failure mode:
- An outcome number, in the currency the business uses. Revenue, qualified leads, activations, calls — whichever the model above assigns. This one answers “did it pay”.
- A demand number that is not branded. Non-branded impressions or non-branded clicks, because branded search rises and falls with everything else marketing does and will flatter any SEO report it appears in.
- A coverage number. Indexed pages earning at least one impression, or one click. This answers whether the site is even eligible to compete, and it reads reliably at low volume because it is a count.
- Optionally, an efficiency number — cost per qualified outcome from organic — once the volume test above is passed for it.
Technical work belongs in this frame as counts, not rates: URLs indexed and earning impressions, errors by class, money pages passing Core Web Vitals. The technical SEO audit checklist covers what to check and in what dependency order; for KPI purposes the point is that a count of 14 blocking issues is readable immediately, while “technical health score 78” is not readable at all.
What goes in the report around these numbers — the rhythm, the format, which figures a client sees — is a related but distinct question, and we treat it separately in the piece on SEO reports for clients. So is the arithmetic of return, which belongs to the article on SEO ROI.
The shortest defensible SEO KPI set for each of the four models
Four lists, each one three lines long, each line naming the system that produces it.
| Model | Outcome KPI | Demand KPI | Coverage KPI |
|---|---|---|---|
| Ecommerce | Revenue from organic sessions (analytics) | Non-branded impressions (Search Console) | Product and category URLs with ≥1 organic click |
| Lead generation | Qualified leads from organic, counted (CRM) | Non-branded clicks to service pages | Service pages ranking in the top 20 for a named query |
| SaaS | Organic signups reaching activation (product analytics) | Non-branded impressions on solution pages | Documentation and comparison URLs earning impressions |
| Local | Calls and direction requests (Business Profile) | Profile impressions, Maps and Search separately | Locations with a complete profile and ≥1 review this quarter |
Two rules make the set work. Report counts monthly and rates quarterly, unless you clear roughly 100 conversion events a month. And attach the decision sentence to each line before the period starts — the one that says what happens if the number moves — because a KPI with no decision attached is a metric that has been promoted by mistake.
If you want a second opinion on which of these your model should be reporting, that is part of what we do in our SEO services: the KPI set gets agreed before the work starts, so the first report is not the first time anyone discusses what counts as success.
12 / Reader questions
Frequently asked questions
01What are the 5 main SEO KPIs?
There is no universal five, because the denominator differs by business model. The frame that travels is three core slots — an outcome number in the currency the business uses, a non-branded demand number, and a coverage number of pages earning at least one click — plus cost per qualified outcome once volume allows, and your model's own denominator — revenue per session, qualified leads, activations or calls.
02What is the difference between an SEO KPI and an SEO metric?
A metric is any number the tools will hand you; a KPI is the small subset someone has agreed to act on. Impressions, crawl depth and average position are metrics. They become KPIs only when a named person has said in advance what they will do if the number moves in either direction.
03How much traffic do you need before an SEO KPI means anything?
Around 100 conversion events per reporting period, almost regardless of the conversion rate itself. At a 2% conversion rate that is roughly 4,750 sessions; at 10% it is about 870. Below that, the 95% interval around the percentage is wider than the change you are trying to detect.
04What are the technical SEO KPIs?
Technical work is best measured with counts rather than rates: indexed URLs that earn at least one impression, the number of crawl errors of each class, and the number of money pages passing Core Web Vitals thresholds. All three are counts, so they read reliably at low volume in a way percentages do not.
05Which SEO KPIs should a marketing manager report on?
One outcome number in the currency the business uses, one demand number that is not branded, and one coverage number showing how much of the site is eligible to compete. Three lines fit on a page, and each maps to a different failure mode: no money, no demand, no eligibility.