
Published
A marketing budget template is a grid: spend lines down the side, months or quarters across the top, a percent-of-total column at the end. Filling it takes ten minutes. The hard part is the numbers that go in the cells, and even the headline one has two defensible answers — 7.8% of revenue, or 9.0%, depending on whose companies you count.
Where these figures come from. For this query in the United States on 10 August 2026, page one of the organic results was Smartsheet, HubSpot, Smart Insights, a public Google Sheet that turns out to be HubSpot’s own, Asana, monday.com, the American Marketing Association and Spendesk, wrapped in an image pack and a video pack. Every one of them offers a template — mostly blank spreadsheets, though Asana’s and monday.com’s are board templates and HubSpot’s sits behind a form. Not one states what belongs in the cells. The percentages below come from two surveys that publish their samples: the Gartner 2026 CMO Spend Survey (401 marketing leaders across North America, the UK and Europe, fielded January to March 2026, the large majority at companies above $1 billion in revenue) and the 2026 edition of The CMO Survey run out of Duke’s Fuqua School (308 US marketing leaders responding out of 2,111 invited, fielded 7–29 January 2026, 97% at VP level or above). Anything derived rather than published is labelled as derived.
The grid: seven rows every marketing budget template has, and two it leaves out
Copy this. It is the same shape as the templates the first page of Google gives away, with two rows added.
| Line | Q1 | Q2 | Q3 | Q4 | Year | % of total |
|---|---|---|---|---|---|---|
| People | ||||||
| Paid media | ||||||
| Agencies and contractors | ||||||
| Software and data | ||||||
| Content and production | ||||||
| Events and sponsorship | ||||||
| Brand and creative | ||||||
| Measurement | ||||||
| Unallocated reserve | ||||||
| Total | 100% |
The two added rows are the ones that decide whether the budget survives contact with the year.
Measurement covers analytics, attribution work, incrementality tests and research. Without its own line it gets paid for out of paid media, which means it competes with the thing it is supposed to evaluate, and it is the first item cut in a bad quarter. Budget it separately or accept that you will end the year unable to say which line worked.
Unallocated reserve is money deliberately left unassigned so that a channel that turns out to be working can be scaled mid-year. With no reserve, scaling a winner means defunding something already committed, which is a political act rather than a financial one, and it usually does not happen. A reserve of 10% to 15% is enough to double one channel’s spend for a quarter.
One warning about the seven standard rows: they do not map onto the four buckets that published benchmarks use. Gartner splits a marketing budget into labour, paid media, martech and agencies. Content and production sits inside labour or agencies depending on who makes it; events sit inside paid media; brand and creative sits in all three. So a grid organised by department will never compare cleanly to a benchmark organised by procurement. Keep both views if you intend to benchmark.
Percent of revenue: 7.8% and 9.0% are both right
The two most-cited 2026 figures for marketing as a share of revenue disagree, and the disagreement is not about marketing. It is about which companies got asked.
- 7.8% — Gartner, 401 marketing leaders, the large majority at companies above $1 billion in revenue. Up from 7.7% in 2025, a rise of 1.3%, and roughly 18% below where the same measure sat four years earlier.
- 9.0% — The CMO Survey, 308 US marketing leaders across all company sizes. Marketing also accounted for 9.6% of total company budget, which the survey notes is its lowest reading since 2021.
Inside The CMO Survey’s own data, the two largest revenue bands report 5.7% ($1–9.9 billion) and 9.5% ($10 billion and above). Those two numbers bracket Gartner’s 7.8%. The surveys are not contradicting each other; one of them is mostly measuring big companies and the other is measuring everyone.
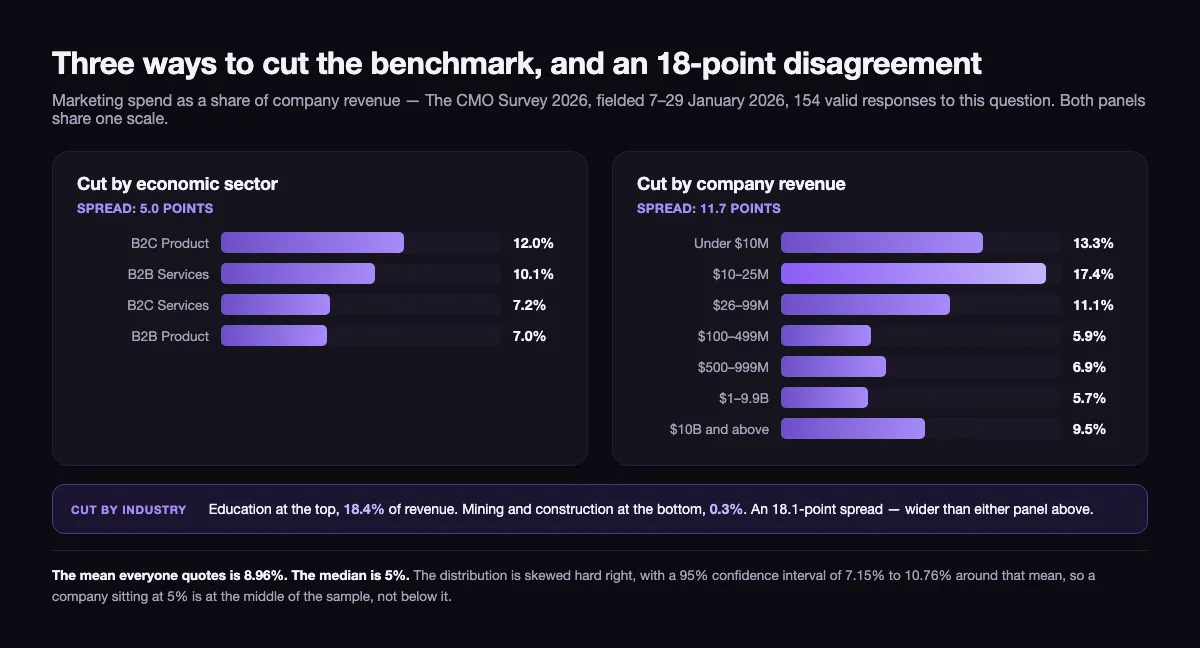
There is a second reason to be careful with the 9.0%, and it is buried in the same survey’s topline. That figure is a mean of 8.96% across 154 valid responses, with a standard deviation of 11.45 and a 95% confidence interval running from 7.15% to 10.76%. The median is 5%. The distribution is skewed hard to the right by a minority of very heavy spenders, so a company sitting at 5% of revenue is at the middle of the sample, not below it — which is the opposite of the impression the headline average gives.
Three ways to cut the benchmark, and an 18-point disagreement
The same 2026 survey publishes the revenue percentage cut three different ways, and the three cuts do not agree about how much variation there is.
| Cut | Lowest | Highest | Spread |
|---|---|---|---|
| Economic sector, four groups | B2B Product 7.0% | B2C Product 12.0% | 5.0 points |
| Company revenue, seven bands | $1–9.9B 5.7% | $10–25M 17.4% | 11.7 points |
| Industry, top against bottom | Mining and construction 0.3% | Education 18.4% | 18.1 points |
The cut most templates and most benchmark articles reach for is the first one, and it is the narrowest of the three. B2C Product 12.0%, B2B Services 10.1%, B2C Services 7.2%, B2B Product 7.0% — five points separate the extremes, which is less than the gap between two companies in the same sector at different sizes.
Company size, in full: under $10 million 13.3%, $10–25 million 17.4%, $26–99 million 11.1%, $100–499 million 5.9%, $500–999 million 6.9%, $1–9.9 billion 5.7%, $10 billion and above 9.5%.
Two things fall out of that list. The first is that the curve is not a straight line down. It peaks in the $10–25 million band rather than the smallest one, bottoms out at $1–9.9 billion, and rises again at $10 billion and above — so “bigger company, smaller percentage” is a reasonable rule from the mid-market up to the low billions and wrong at both ends. The second is that a $20 million B2B services firm and a $6 billion B2B services firm share a sector row of 10.1% and share nothing else: their size rows read 17.4% and 5.7%.
Industry is wider than either, and it is the cut that should retire the “spend 10 to 20% of revenue” advice for good. Education firms in this sample reported 18.4% of revenue going to marketing; mining and construction firms reported 0.3%. Both numbers are real and neither is a useful default for anyone outside those industries.
One caveat on all of the above. The revenue question drew 154 valid responses out of the 308 who took the survey, so seven revenue bands and a dozen-plus industries are being cut from roughly twenty responses each. Use these as the order of magnitude for your band, not as a target to hit to one decimal place.
Inside the budget: where the four big buckets sit in 2026
Once the total is set, the next cell to fill is the split. Gartner’s four-bucket view for 2026, from the same 401 respondents:
| Bucket | 2026 share | Direction |
|---|---|---|
| Paid media | 31.4% | Up from 25.1% in 2021 |
| Labour | 24.5% | Up from 21.9% in 2025 |
| Agencies | the remainder, about a quarter | Falling — Gartner attributes the rise in paid media to cuts here |
| Martech | 19.4% | Down from 26.6% in 2021 |
The agency figure is arithmetic rather than a published number: Gartner presents these four as the components of the budget, and the three published shares leave roughly 24.7% for agencies. Read it as “about a quarter, and shrinking.”
The five-year movement in that table is a transfer out of software and outside help and into media: martech has lost about seven points of budget share since 2021 while paid media has gained six. Labour’s rise is a shorter story — 21.9% to 24.5% is a single year, 2025 to 2026. Marketing leaders also reported putting 15.3% of the budget into AI, and the subset Gartner classes as AI-mature spends 8.9% of company revenue on marketing overall against 7.8% for everyone; the mature adopters are spending more in total, not less.
Below the bucket level, the channel detail worth copying into a template:
- Search advertising takes 16% of the digital budget, up from 14.8%; social advertising 15.7%, up from 12.7%; SEO 9.4% of the owned and earned digital budget.
- Offline is led by events at 23.1% of offline spend, then sponsorships at 18.2% and linear TV at 15.5%.
- Social media accounts for 14.3% of the whole marketing budget in The CMO Survey’s reading, with respondents projecting 17.1% within a year and 23.1% within five. The same survey notes that its twelve-month social projections have historically overshot actual spending by an average of 2.1 percentage points.
- Digital marketing spend grew 8.2% year on year while total marketing spend grew 1.7%, and traditional advertising is projected to fall 1.5%.
If you are sizing the paid search line specifically, the arithmetic that turns a monthly figure into clicks and conversions is a separate exercise — we worked it through in how much Google Ads actually cost.
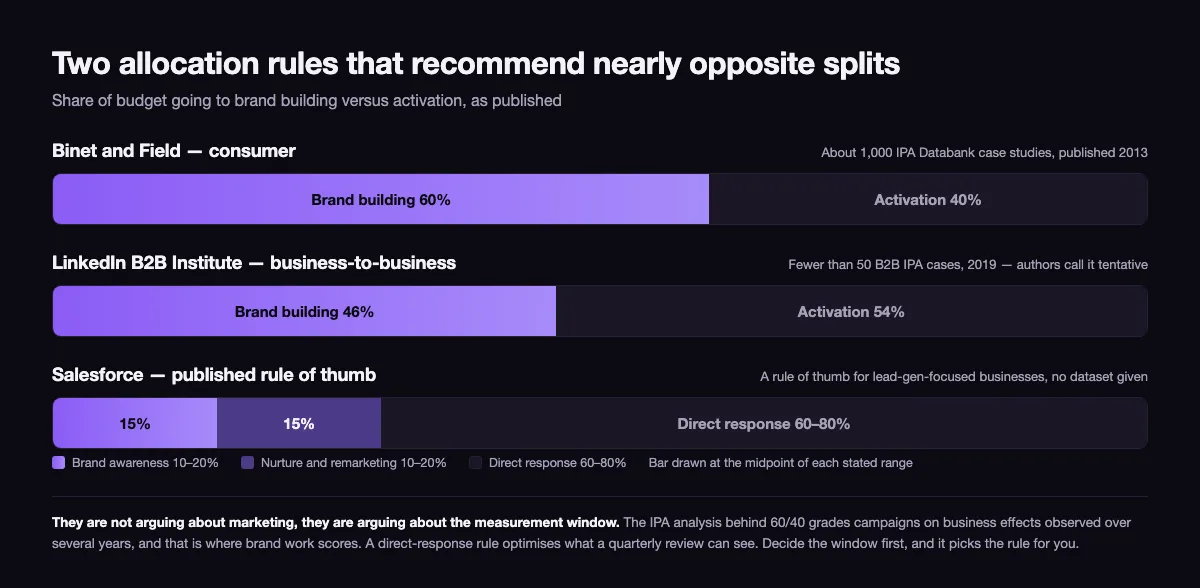
Two allocation rules that recommend nearly opposite splits
Here is the fork that no template mentions, and it changes the shape of the whole budget.
| Rule | Brand building | Nurture and remarketing | Direct response | Basis |
|---|---|---|---|---|
| Binet and Field, consumer | 60% | — | 40% | About 1,000 IPA Databank case studies, published 2013 |
| LinkedIn B2B Institute, business-to-business | 46% | — | 54% | Fewer than 50 B2B cases in the same databank, published 2019; the authors call the finding tentative and UK-skewed |
| Salesforce’s published rule of thumb | 10–20% | 10–20% | 60–80% | Stated as a rule of thumb for businesses focused on lead generation, no dataset given |
Binet and Field put 60% of a consumer budget into brand building. Salesforce puts 10 to 20%. Even if you generously count nurture and remarketing on the brand side — and you should not, since both are activation working on people who already know you — the Salesforce rule tops out at 40% where Binet and Field start at 60%.
They are not really arguing about marketing. They are arguing about the measurement window. The IPA analysis behind 60/40 grades campaigns on business effects observed over multiple years, and long-term effects are where brand work scores. A direct-response rule of thumb optimises what a quarterly review can see. Both are internally consistent; they answer different questions, and a template that asks you for one percentage per channel hides the fact that a question was asked at all.
The practical resolution is to decide the window first and let it pick the rule. If nobody in your company will still be measuring this campaign in three years, the 60/40 recommendation is not wrong so much as unenforceable, and you should budget closer to the activation-heavy end while being honest that you are trading future efficiency for present legibility.
Launch, growth and retention need three different shapes
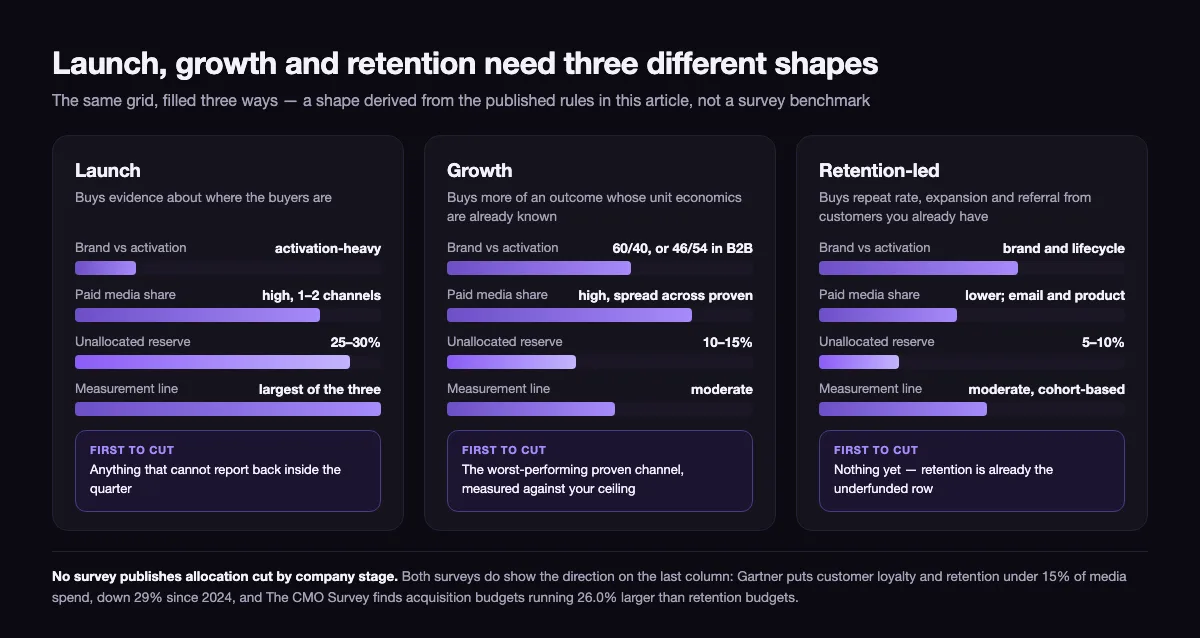
The same grid gets filled three different ways depending on what the business is currently doing, and conflating them is the most common budgeting error we see. A launch budget buys information. A growth budget buys volume of a known outcome. A retention budget buys frequency from people who already bought.
| Launch | Growth | Retention-led | |
|---|---|---|---|
| What the money buys | evidence about where buyers are | more of an outcome with known unit economics | repeat rate, expansion, referral |
| Brand vs activation | activation-heavy; brand work has nothing readable to attach to yet | move toward 60/40, or 46/54 in B2B | brand and lifecycle content carry more of it |
| Paid media share of budget | high, concentrated in one or two channels | high, spread across proven channels | lower; the work moves into email, lifecycle and product |
| Unallocated reserve | 25–30% — you do not yet know what you will want to double | 10–15% | 5–10% |
| Measurement line | largest share of the three; learning is the deliverable | moderate; the questions are narrower | moderate, but shifted to cohort analysis |
| First thing to cut when it goes wrong | anything that cannot report inside the quarter | the worst-performing proven channel | nothing yet — retention is already the underfunded row |
That table is a shape, not a benchmark. It follows from the published rules named above and from the survey figures in this article; no survey we could find publishes allocation cut by company stage, so treat the ranges as a starting position to argue with rather than a number to cite.
The launch column has one hard constraint worth stating plainly: a channel needs a certain volume of conversions before its cost per acquisition can be told apart from your ceiling, and below that volume you have bought noise rather than evidence. Splitting a small launch budget across four channels usually buys four unreadable results instead of one readable one. That arithmetic — how many conversions a verdict needs, and how many channels a given budget can therefore afford to read — is worked out in full in our go-to-market budget guide for the first 90 days.
Retention is the row the data says is underfunded
Both surveys point the same direction on the same line, from different angles.
Gartner’s June 2026 read of media spend found awareness and conversion together taking 62.6% of total media spend, while customer loyalty and retention took under 15% — a share that has fallen 29% since 2024. Subtracting those leaves a little over a fifth for consideration, a figure Gartner does not publish directly. The CMO Survey, asking about budgets rather than media, found acquisition budgets running 26.0% larger than retention budgets, up from 19.6% a year earlier, and notes that retention has been delivering the stronger performance of the two.
The same survey also reports where growth money goes: 56.4% to selling existing products in existing markets, 22.9% to new products in existing markets, 14.1% to existing products in new markets and 6.5% to genuinely new products in new markets. More than half of growth spending is aimed at selling what you already have to more of the market you are already in, which is the activity most exposed to acquisition costs rising.
None of this makes retention automatically the right place to move money. It does mean that if your template has no retention line at all — and most of the free ones do not — you are matching the market’s default rather than making a decision. Whether moving budget there pays depends on what a retained customer is actually worth to you over their lifetime, which is its own calculation and one people routinely get wrong by using an average lifespan they cannot support; the customer lifetime value formula breaks down which inputs are load-bearing.
Filling the grid in the order that stops it being fiction
The order matters because each step constrains the next, and templates invite you to start at the wrong end — with a list of channels.
- Set the total from the revenue target, then sanity-check it against the percentage. Work out what the year has to produce and what that costs at your current cost per result. Then compare the answer to the size band you sit in. If your target implies 22% of revenue and your band reads near 6%, either the target or the efficiency assumption is wrong, and finding that out in the spreadsheet is cheaper than finding out in November.
- Split into the four benchmark buckets before splitting by channel. Labour, paid media, agencies, martech. This is the only cut that can be compared to anything outside your company.
- Choose the measurement window, and let it pick the brand-versus-activation rule. This is a decision, not a default. Write down which one you chose.
- Allocate paid media across funnel stages. Awareness, consideration, conversion, retention. If retention comes out at zero, say out loud that it is zero.
- Fill the channel lines inside those stage allocations. Not before. A channel list written first will always spend the whole budget and leave nothing for steps 6 and 7.
- Fund the measurement line. If it has no money, the rest of the grid is unfalsifiable.
- Hold back the reserve. 10% to 15% in a normal year, more at launch.
- Set the review date on the document itself. Quarterly for allocation, monthly for spend against it.
Steps 1 through 4 are where the year is decided; steps 5 through 8 are bookkeeping. Most budget documents invert that ratio.
When to move the split, and what has to be true first
A budget that is never reallocated is not disciplined, it is abandoned. But most mid-year reallocations happen on evidence that would not survive being written down, so three conditions before you move money between lines:
The channel has produced enough conversions for the comparison to mean something. Not enough spend, enough conversions. A channel with 11 conversions has an interval around its cost per acquisition wide enough to contain almost any conclusion you would like it to.
The comparison is against your ceiling, not against another channel. Two channels can both be above your acceptable cost, and reallocating from the worse to the better in that situation just spends the money more slowly.
The reason is not that a number moved this month. Monthly noise on a small conversion base is large. The reason a quarterly cadence beats a monthly one has nothing to do with attention span and everything to do with sample size.
Everything above sits inside a bigger document. The budget is one section of the marketing plan — the plan sets the goal, the customer, the positioning and the measurement, and the budget turns that into money by line and by month; the section list and three worked plans are in our marketing plan template. If the harder question is not the arithmetic but whether the plan behind it is aimed at the right thing, that is what our marketing strategy work is for.
10 / Reader questions
Frequently asked questions
01What is a marketing budget template?
A marketing budget template is a grid of spend lines against time periods, with a percent-of-total column at the end. Seven lines are standard — people, paid media, agencies, software, content, events, brand — and two are usually missing: a measurement line and an unallocated reserve. The grid is the easy part; the numbers are not.
02What percentage of revenue should go to marketing?
The mean is about 9% and the median is 5%. US marketing leaders reported a mean of 8.96% of revenue in January 2026, but half of them reported 5% or less, so the average everyone quotes sits well above the middle of the sample. Gartner's separate survey of mostly billion-dollar companies reported 7.8%.
03How do you structure a marketing budget?
Start from the revenue target, not the percentage. Set the total, split it into the four buckets that benchmarks actually use — labour, paid media, martech and agencies — then allocate the paid media portion across funnel stages, and only then fill in the monthly grid. Structuring by channel first is what produces budgets that cannot be compared with anything.
04What is the 70/20/10 rule for marketing budget?
The 70/20/10 rule puts 70% of the budget into tactics already proven to work, 20% into emerging channels showing early promise, and 10% into experiments with no track record. It is a portfolio heuristic traceable to Google's resource-allocation model in the mid-2000s and Coca-Cola's content model soon after, widely republished in the early 2010s, and no published dataset establishes those three numbers as optimal.
05How much should a small business spend on marketing?
Small companies report the highest percentages of anyone. In The CMO Survey's 2026 edition, firms in the $10–25 million revenue band reported spending 17.4% of revenue on marketing, and firms with fewer than 50 employees reported 16.3%. The 7–8% figure often credited to the Small Business Administration comes from a 2019 SBA blog post quoting a third-party average, and that post itself says there is no hard and fast answer.
06Where can I get a free marketing budget template?
Every result on the first page for this query offers one, including Smartsheet, Smart Insights, Asana, monday.com, Spendesk and the American Marketing Association, though HubSpot's sits behind a form. Any of them will do, because the grid is not where budgets fail. Copy the table in this article if you want one with a measurement line and a reserve line already in it.
07What is the difference between a marketing budget and a marketing plan?
The budget is one section of the plan. The plan states the goal, the customer, the positioning, the channels and how the result gets measured; the budget converts that into money by line and by month. A plan without a budget is a wish, and a budget without a plan is a spreadsheet nobody can defend.
08How often should a marketing budget be reviewed?
Quarterly for the allocation, monthly for the spend against it. Quarterly is short enough that a losing channel does not run a full year, and long enough that most paid channels have accumulated the conversion volume needed for the comparison to mean anything. Anything reviewed monthly gets reallocated on noise.