Published
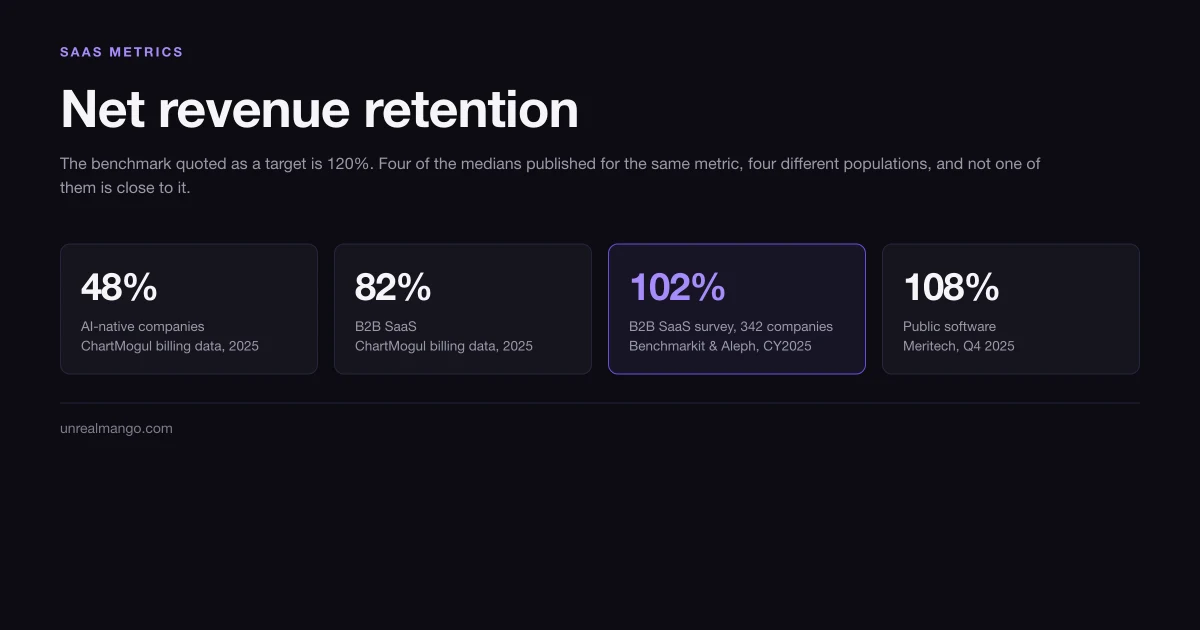
Net revenue retention is the share of a period’s opening recurring revenue that the same customers still pay at the end of it, after expansion, contraction and churn. New customers are excluded from both halves of the fraction. The median in the most recent survey data is 102%, not 120%.
How this was checked. The 120% figure that circulates as a target came from a different population than the one most companies belong to. In August 2026 we set seven published medians from five sources side by side — Benchmarkit’s 2025 and 2026 B2B SaaS metrics reports, SaaS Capital’s 2025 and 2026 surveys of private B2B SaaS, Meritech’s public-software pulse for Q4 2025, and ChartMogul’s retention report built from billing data rather than self-reporting — and recorded what each one measured, over what window, on how many companies. Definitions come from the SaaS Metrics Standards Board. Every arithmetic example below is ours and is worked in full; where a number is our inference rather than a published figure, it says so.
New customers sit outside both halves of the fraction
Almost every growth number a company reports can be moved by selling to someone new. Total revenue can. Growth rate can. Annual recurring revenue can, in the same quarter the contract goes live. Net revenue retention cannot, and that is the whole reason it exists.
The SaaS Metrics Standards Board, an industry body that publishes standardised definitions for B2B SaaS metrics, states the cohort method as: “MRR at the end of accounting period from the cohort of customers at the beginning of the period / MRR from the customers at the beginning of accounting period.” It then adds the sentence that does the work: “Any new customers acquired over the year are excluded from the calculation.”
Take a company that opens the year with 100 customers paying $1,000 a month each — $100,000 of opening monthly recurring revenue. Over the following twelve months it signs 40 new customers at the same price, and the original 100 shrink to $95,000 between cancellations, downgrades and a handful of upgrades.
| Number | Value | What moved it |
|---|---|---|
| Opening MRR | $100,000 | — |
| MRR from the same 100 customers, twelve months later | $95,000 | Expansion, contraction, churn |
| New customer MRR added | $40,000 | Sales |
| Closing MRR, all customers | $135,000 | Both |
| Growth in total MRR | +35% | Mostly sales |
| Net revenue retention | 95% | Not sales |
The company grew 35% and retained 95%. Both are true, and only one of them can be fixed by hiring another account executive. This is also why the metric is read as a durability signal in diligence: it is the one line on the page that a good quarter of new business cannot decorate.
The stage-by-stage mechanics of the pipeline that produced those 40 new customers are a separate question with its own definitions — our breakdown of MQL vs SQL covers where one stage ends and the next begins. None of it touches the number above.
The formula, and the three movements that decide it
Written out, the calculation is one line:
NRR = (Opening MRR + Expansion − Contraction − Churn) ÷ Opening MRR × 100
Three movements feed the numerator. Any of them can be zero in a given period:
- Expansion — up-sell, cross-sell, price increases and, where the contract allows, increased usage from customers who were already there.
- Contraction — down-sell: the same customer, a smaller commitment.
- Churn — the customer leaves entirely.
Against them sits one fixed denominator: opening MRR, set on day one of the period and never restated. That is what makes the metric a cohort measure rather than a growth measure.
A worked example on a company opening the period with $500,000 of monthly recurring revenue from its existing base:
| Movement | Value |
|---|---|
| Opening MRR (cohort) | $500,000 |
| Expansion | +$70,000 |
| Contraction | −$25,000 |
| Churn | −$60,000 |
| Closing MRR from that cohort | $485,000 |
| Net revenue retention | 97.0% |
| Gross revenue retention | 83.0% |
Gross retention drops the expansion line and keeps the two subtractions: ($500,000 − $60,000 − $25,000) ÷ $500,000 = 83.0%. The 14-point gap between the two is the entire contribution of the expansion engine, and it is close to the gap SaaS Capital reports as typical — more on that below.
Two details decide whether your number is comparable to anyone else’s. The first is whether the denominator is monthly recurring revenue or annual recurring revenue; the arithmetic is identical, but the normalisation rules that turn contracts into a recurring figure are not, and they are where two companies most often stop measuring the same thing. Those rules — what counts as recurring, what a multi-year deal contributes, what happens to usage above a committed minimum — belong to annual recurring revenue and are worth settling before you divide anything. The second is the period, which turns out to matter more than most reporting admits.
The median sits between 48% and 108%, depending on who was counted
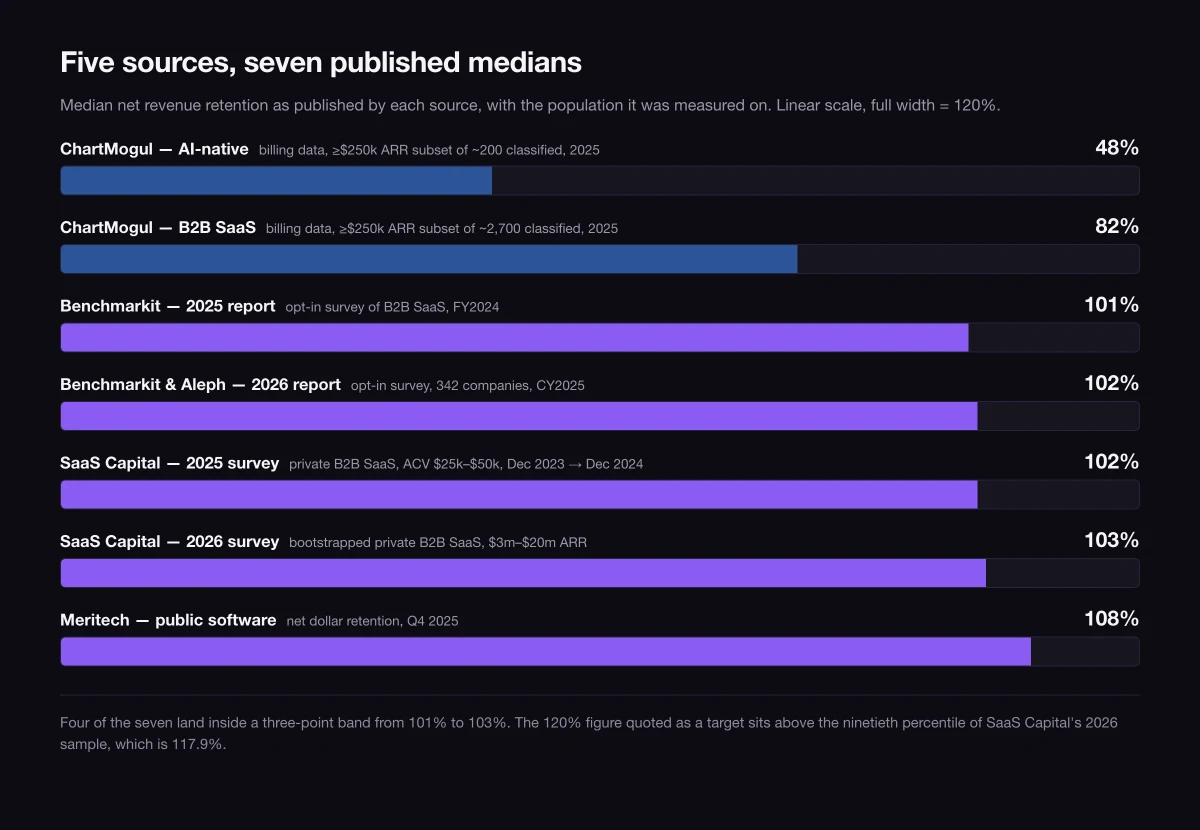
Five sources, seven published medians, and every one of them is honestly reported. What separates them is not measurement error but the population each one drew from.
| Source | Population | Sample | Period measured | Median NRR |
|---|---|---|---|---|
| ChartMogul, The SaaS Retention Report: The AI churn wave | AI-native companies, billing data, ≥$250k ARR | ~200 classified; the ≥$250k subset is not disclosed | 2025 | 48% |
| ChartMogul, same report | B2B SaaS, billing data, ≥$250k ARR | ~2,700 classified; the ≥$250k subset is not disclosed | 2025 | 82% |
| Benchmarkit, 2025 SaaS Performance Metrics | B2B SaaS, self-reported survey | not disclosed | FY2024 | 101% |
| Benchmarkit and Aleph, 2026 SaaS & AI Performance Benchmarks | B2B SaaS and AI-native software, self-reported survey | 342 companies | CY2025 | 102% |
| SaaS Capital, 2025 survey | Private B2B SaaS, ACV $25k–$50k | not disclosed | Dec 2023 → Dec 2024 | 102% |
| SaaS Capital, 2026 survey | Private B2B SaaS, bootstrapped, $3m–$20m ARR | >1,000 in the full survey | window not stated; published April 2026 | 103% |
| Meritech Software Pulse, 20 March 2026 | Public software companies | index, count not stated | Q4 2025 | 108% |
Sixty points separate the top row from the bottom one — and four of the seven land inside a three-point band from 101% to 103%. For context on how far 120% sits from any of them: SaaS Capital’s 2026 survey puts the ninetieth percentile at 117.9% for bootstrapped companies with $3m to $20m in ARR, and Meritech describes the public-software median of 108% as “close to their lowest point in years… but do show signs of rebounding.” A company at 105% is not underperforming a 120% benchmark. It is above the median of every private-company dataset published in the last two years.
The quartiles matter as much as the medians, because they set the actual shape of the distribution. In SaaS Capital’s 2025 survey, the ACV $25,000–$50,000 bracket showed a median of 102%, a top quartile of 111% and a bottom quartile of 97% — a fourteen-point spread across the middle half of the market. In ChartMogul’s billing data, the B2B SaaS upper quartile was 97%, which is below the median of every survey in the table.
Population, not performance, explains most of that range
Three differences account for nearly all of the sixty points, and none of them is about how well the companies are run.
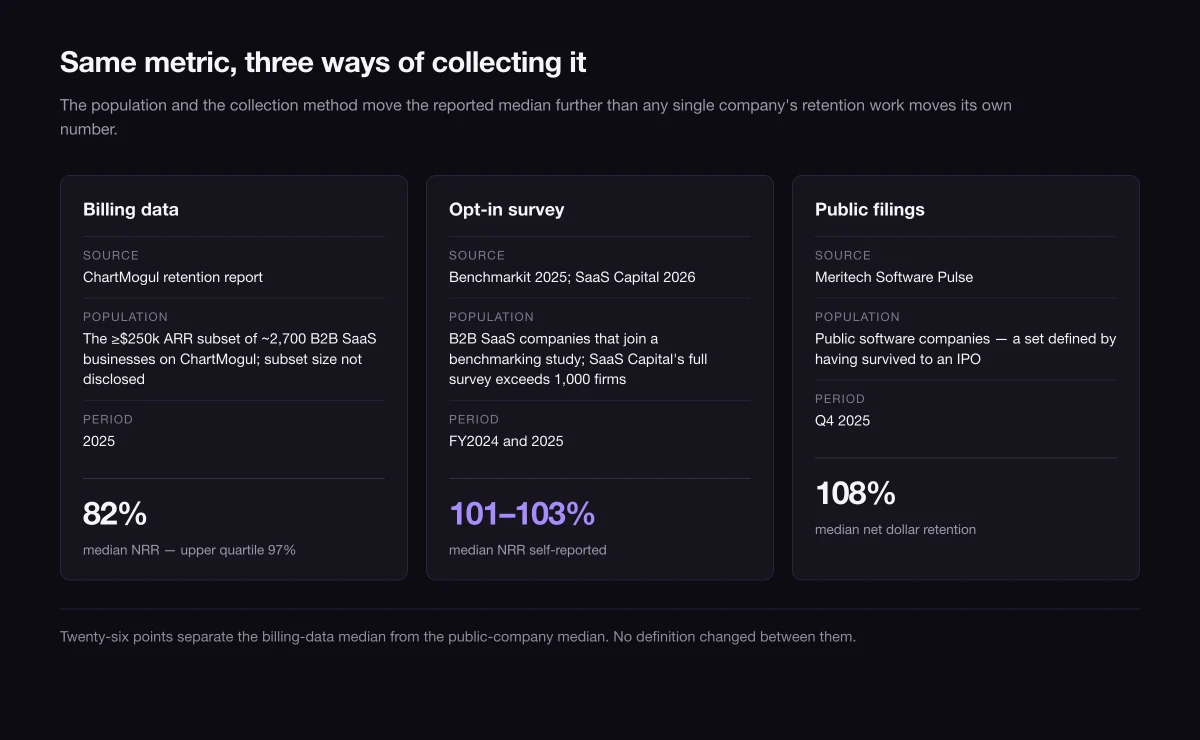
Who is in the sample. ChartMogul measures subscription businesses using ChartMogul, with a $250,000 ARR floor — a population weighted towards self-serve and small-business software, where a customer can cancel in a browser tab. SaaS Capital and Benchmarkit survey B2B SaaS companies that opt into a benchmarking study, skewing larger, more sales-led and higher-ACV. Meritech measures companies that completed an IPO, which is close to a definition of survivorship. The metric is identical in all three; the customer base is not.
How the number was produced. Billing data reports what happened. A survey reports what a finance team typed into a form, using its own definition, with no auditor between the two. Neither is dishonest, but they answer slightly different questions, and only one of them can be wrong in a consistent direction. That cuts both ways for the headline of this article: the 101% to 103% band comes from self-reported surveys, and the billing-data figure of 82% is the more conservative reading of the same metric on a smaller, more self-serve population. The number to compare yourself against is the one drawn from companies that look like yours. Neither of them is 120%.
When it was measured. Retention is currently moving. Benchmarkit’s 2026 report shows median gross revenue retention falling from 88% to 84% and the seventy-fifth percentile from 95% to 91%, and files the finding under a heading that most vendor pages would not write: retention is deteriorating market-wide, which the report frames as a market-level structural dynamic rather than company-level execution. ChartMogul’s AI-native cohort moved inside a single year too, with median gross retention rising from 27% in January 2025 to 40% in September.
That last row deserves its own line. AI-native companies in ChartMogul’s data show a median gross retention of 40% and a median NRR of 48%, and the pattern inside that cohort tracks price almost perfectly: above $250 a month, 70% gross and 85% net; between $50 and $249, 45% and 61%; below $50, 23% and 32%. Whatever else that describes, it is not a subscription business in the sense the benchmarks above assume.
Annualising one month compounds it twelve times
The Standards Board notes that the period between the opening and closing figures “is typically one year” and then spells out the shorter-period case in one sentence: “If the calculation period is less than one year, it can be annualized by taking the result to the appropriate power. For example, if measured over a quarter, take the result to the 4th power, and if measured over a month, take the result to the 12th power.” The instruction is explicit, and it is still the step most reporting skips.
Annualising a monthly rate means raising it to the twelfth power, not adding twelve times the monthly movement. The difference is small at the median and large at the top:
| Monthly NRR | Annualised (compounded correctly) | Monthly movement × 12, incorrectly |
|---|---|---|
| 99.5% | 94.2% | 94.0% |
| 101.0% | 112.7% | 112.0% |
| 101.5% | 119.6% | 118.0% |
Read the third row backwards and the headline benchmark stops sounding heroic: 120% a year is 1.5% net expansion a month. It is also, in the other direction, a warning about what a single good month does to an annualised figure. A company that annualises a month containing its yearly price increase is compounding a one-off event twelve times, and it will report a number no twelve consecutive months will reproduce.
SaaS Capital’s survey avoids the problem by fixing the window explicitly: monthly recurring revenue in December 2024, from customers who were already customers in December 2023, divided by total MRR in December 2023. That definition is worth copying, because it forecloses the two most common ways the number drifts — a rolling cohort that quietly re-baselines, and an annualisation that inherits a spike.
Cohort choice moves it as well. A cohort defined at the start of a year that included an unusually large signing month carries that month’s churn risk for the whole measurement window, which is why a single number without a stated cohort and window is a claim rather than a measurement. Where cohorts get used for something other than retention — the arithmetic of value per customer over a lifetime — our walkthrough of the customer lifetime value formula shows what the same cohort data supports and what it does not.
Gross revenue retention is the floor under the net number
Net revenue retention can be excellent while the business underneath it is emptying out, and gross revenue retention is the only cheap way to tell.
The Standards Board’s formula is ((Beginning MRR − Churned MRR − Down-Sell MRR) ÷ Beginning MRR) × 100, and it writes that gross retention “will always be less than 100% as it does not include up-sell, cross-sell or usage expansion.” Nothing is ever added back, so 100% is a ceiling the metric cannot break through.
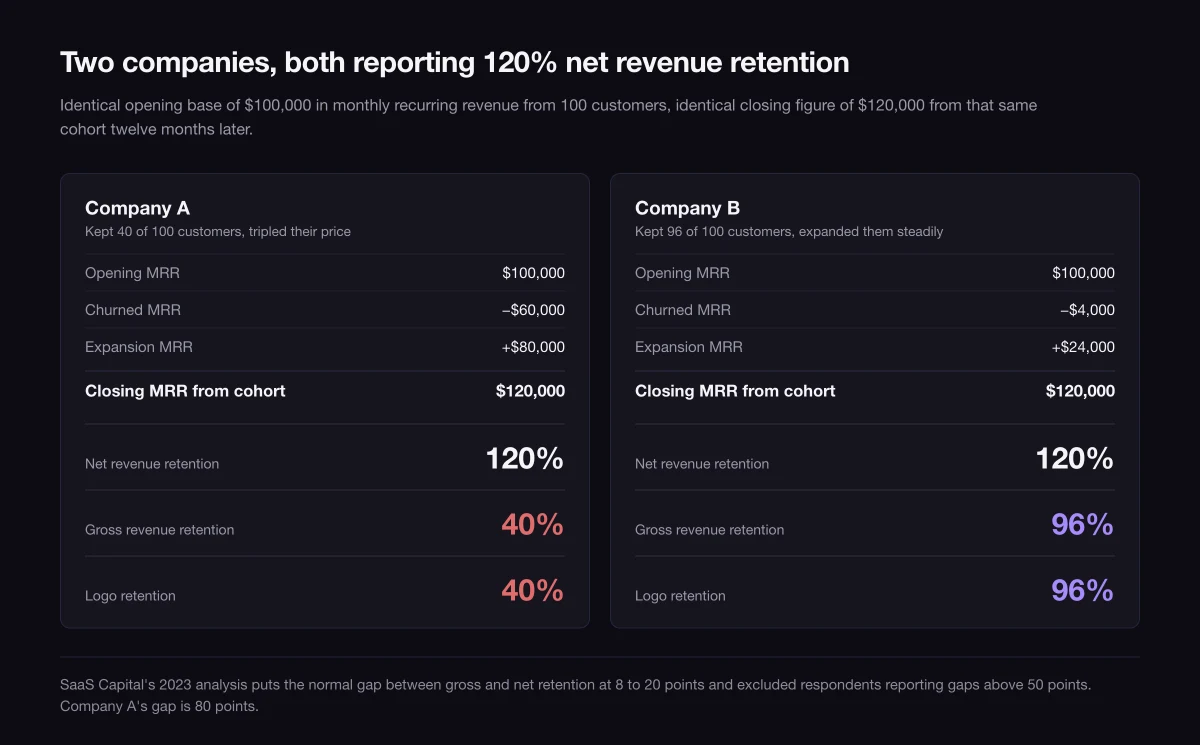
Two companies both report 120% net revenue retention:
| Company A | Company B | |
|---|---|---|
| Opening MRR | $100,000 | $100,000 |
| Customers at open | 100 | 100 |
| Customers retained | 40 | 96 |
| Churned MRR | −$60,000 | −$4,000 |
| Expansion MRR | +$80,000 | +$24,000 |
| Closing MRR from cohort | $120,000 | $120,000 |
| Net revenue retention | 120% | 120% |
| Gross revenue retention | 40% | 96% |
| Logo retention | 40% | 96% |
Company A lost sixty of its hundred customers and covered the hole by tripling the price on the forty that stayed. Company B kept almost everyone and expanded them steadily. On the metric everyone quotes, they are identical.
The size of the gap between the two numbers is itself a benchmark. SaaS Capital, analysing its survey data in August 2023, put the average difference between gross and net retention at “a bit more than twelve percentage points,” with 8 to 20 points as the normal range, gaps under 5 points in fewer than 10% of companies, and gaps above 20 points as somewhat abnormal — it excluded a handful of respondents reporting a gap over 50 points as outliers. Company A’s 80-point gap is outside the range the study was willing to keep in its dataset.
That relationship also lets you sanity-check a headline. The 2026 Benchmarkit and Aleph report publishes both halves for calendar 2025: median gross retention of 84% against median net retention of 102%, an 18-point gap, wider than the 13 points of its 2025 pairing (88% gross, 101% net) and still inside the 8-to-20 band SaaS Capital calls normal. The reading is that the median company is losing more of its base than it was and covering the loss with more expansion, which is a different business from the one the same median described two years ago.
Pricing without an expansion vector caps you at gross retention
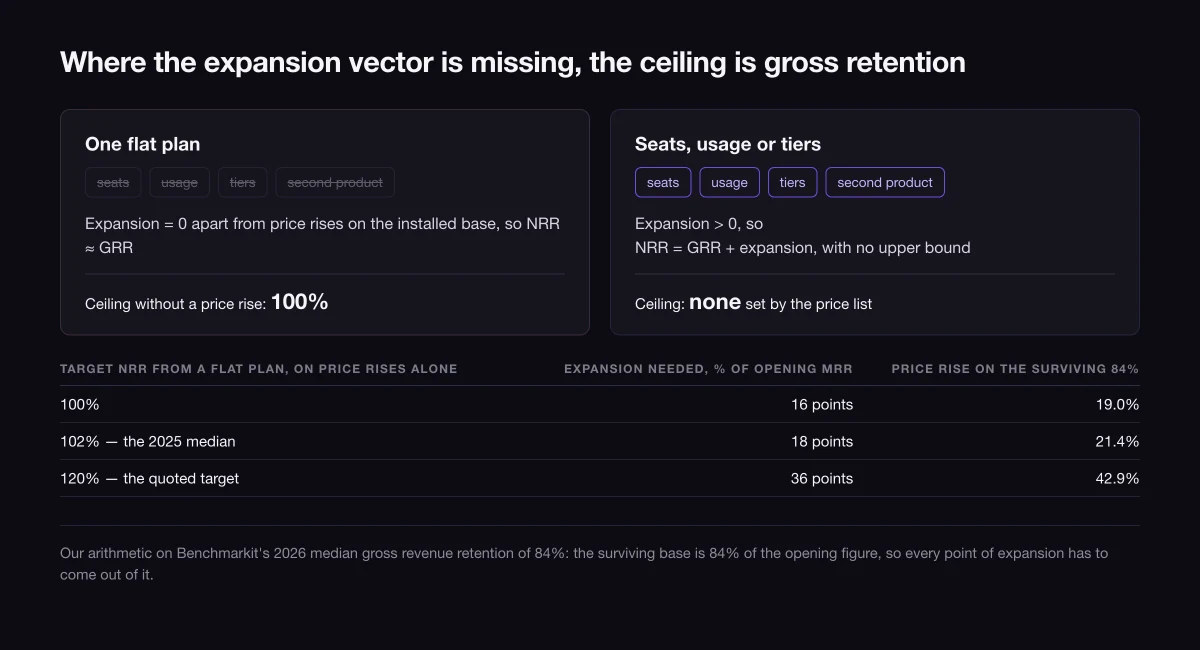
Here is the part the benchmark articles skip. For a set of companies, net revenue retention above 100% is not merely difficult — it is arithmetically unavailable, and no amount of customer success will change that.
Expansion has to come from somewhere. In practice there are four places: more seats, more usage, a higher tier, or an additional product. Strip all four out — one plan, one price, one product, no seats to add and no usage meter — and the expansion line is zero except for price increases on the installed base. When expansion is zero, the net formula collapses into the gross one, and gross retention cannot exceed 100%. A flat single-plan product with a stable price list is capped below 100% by construction, not by execution.
Price increases are the one remaining lever, and it is worth knowing what they would have to do. Take the 2026 median gross retention of 84%: the surviving base is 84% of what you started with, and expansion has to close the remaining gap out of that smaller base.
| Target NRR | Expansion needed, as % of opening MRR | Required price rise on the surviving 84% |
|---|---|---|
| 100% | 16 points | 19.0% |
| 102% — the 2025 median | 18 points | 21.4% |
| 110% | 26 points | 31.0% |
| 120% — the quoted target | 36 points | 42.9% |
Reaching the 2025 median of 102% on price alone would mean putting roughly 21% on every account that stayed, every year. Reaching 120% would mean 43%. Both are our arithmetic on Benchmarkit’s gross retention figure, and both describe a pricing policy no B2B customer base absorbs annually. The practical reading is that a company without seats, usage or tiers is choosing a ceiling when it chooses its price list, and the honest target for it is a high gross retention number rather than a net one above 100%.
This is also why the same NRR means different things at different stages. Before a product has a stable customer base, a low number is a fit problem rather than an expansion problem, and the diagnostic instrument is different — a product-market fit survey tells you whether the churn is coming from the wrong customers, which no pricing change fixes. And a durable net retention figure does not settle whether acquiring those customers was affordable in the first place; that is what the CAC payback period answers, on a different denominator entirely.
NRR, NDR and net retention rate: which term to expect where
Three labels, one calculation. The Standards Board lists net dollar retention as an alternative name for net revenue retention and defines both as “the percentage of recurring revenue retained over a specific period.” Net retention rate is the same measure again, most often in customer-success writing.
| Term | Where it usually appears | What differs |
|---|---|---|
| Net revenue retention (NRR) | Private-company surveys, benchmark reports | Nothing |
| Net dollar retention (NDR) | Public company filings and investor decks | Nothing in the formula; audiences differ |
| Net retention rate (NRR) | Customer-success and vendor content | Nothing |
| Logo retention | Board reporting alongside the revenue metric | Counts customers, not dollars |
The one to keep separate is the last. Logo retention answers how many accounts stayed; the revenue metrics answer how much money did, and Company A above shows how far apart the two can travel. When a document quotes one retention number and no other, it is worth asking which of these it is before comparing it to anything.
Making two retention numbers comparable before you compare them
Six things settle whether two reported figures describe the same measurement. Every one of them is answerable without access to a ledger:
- What is in the denominator — monthly or annual recurring revenue, and normalised under which rules.
- When was the cohort fixed — a stated opening date, or a rolling window that re-baselines itself.
- How long is the period — twelve months measured, or a shorter period annualised, and if annualised, compounded or multiplied.
- Are new customers excluded — from the numerator and the denominator, per the cohort definition.
- What is the gross number — and does the gap between gross and net fall in the 8 to 20 point band that SaaS Capital reports as normal.
- Which population is the benchmark from — billing data or self-reported survey, and whose customer base.
Run those six against your own reporting first. Most of the time the number does not need improving so much as it needs a stated definition, at which point it can be compared to the 101% to 103% that private B2B SaaS companies actually report rather than to a figure borrowed from the ninetieth percentile.
If the underlying question is what to build so that expansion exists at all — pricing structure, packaging, the path from a first purchase to a larger second one — that is a positioning and go-to-market problem rather than a reporting one, and it is the kind of work we do with SaaS and technology companies.
10 / Reader questions
Frequently asked questions
01How do you calculate net revenue retention?
Divide the recurring revenue those customers pay at the end of the period by what the same customers paid at its start, then multiply by 100. The SaaS Metrics Standards Board states the cohort method as MRR at the end of the period from the cohort of customers at the beginning, over MRR from those customers at the beginning. Expansion, contraction and churn all land in the numerator; new customers land in neither half.
02What is a good net revenue retention rate?
Above the median for companies your size, which in 2024–2025 survey data means above roughly 101% to 103%, not above 120%. SaaS Capital's 2026 survey of more than 1,000 private B2B SaaS companies puts the median at 103% for bootstrapped firms with $3m to $20m in ARR and the ninetieth percentile at 117.9%. A number in the low 100s is ordinary, not weak.
03What is the difference between NRR and GRR?
Gross revenue retention subtracts churn and down-sell but adds nothing back, so it cannot exceed 100%. Net revenue retention adds expansion on top, so it can. The SaaS Metrics Standards Board writes that gross retention will always be less than 100% because it does not include up-sell, cross-sell or usage expansion. The gap between the two is where a company's expansion engine shows up.
04What does 120% net revenue retention mean?
It means the customers you had a year ago now pay you 20% more in total, after everything they cancelled and downgraded. It does not mean 20% growth: new customers are excluded from the calculation entirely. At a monthly cadence, 120% a year is 1.5% net expansion per month compounded twelve times.
05Does net revenue retention include new customers?
No. The SaaS Metrics Standards Board is explicit that any new customers acquired over the year are excluded from the calculation. The metric compares one fixed cohort with itself, so revenue from customers who joined after the opening date sits outside both the numerator and the denominator, and a strong sales quarter cannot move it.
06Can net revenue retention be over 100%?
Yes, whenever expansion from existing customers outweighs churn and contraction. Whether it can in your business depends on the pricing: if there are no seats to add, no usage to grow into and no higher tier to buy, expansion can only come from price increases on the installed base, and the metric is capped at gross retention, which cannot exceed 100%.
07Is net dollar retention the same as net revenue retention?
Yes. The SaaS Metrics Standards Board lists net dollar retention as an alternative name for net revenue retention and defines both as the percentage of recurring revenue retained over a specific period. Public companies tend to report NDR, private surveys tend to report NRR, and the label change usually signals a different reporting audience rather than a different calculation.