
Published
Time to value is the elapsed time between a customer starting with a product and the moment they get the first result they signed up for. There is no industry benchmark for it. The one figure in public circulation — 1 day, 12 hours and 23 minutes — describes 547 companies running one vendor’s analytics, and it appears in print as a median in one place and as an average in another.
How this was checked. In August 2026 we read the eight organic results ranking for time to value in the United States, along with the AI Overview above them, and looked for a single measured figure. There was one — not a published range, an actual measurement — and it sits in a source none of those pages cite. We then compared how four published definitions start and stop the clock, and checked the metric against the one industry body that standardises SaaS definitions. Every arithmetic example below is ours and is worked in full; where a number is our inference rather than a published figure, the text says so.
No standards body defines time to value
The SaaS Metrics Standards Board exists to stop exactly this problem. It publishes standardised definitions so that two companies reporting the same metric are reporting the same thing, and its catalogue covers eleven measures: contracted annual recurring revenue, annual recurring revenue, gross revenue retention, net revenue retention, logo retention, the Rule of 40, customer acquisition cost, CAC payback period, and the blended, new and expansion CAC ratios.
Time to value is not one of them. Neither is activation, and neither is onboarding duration.
That absence is the single most useful fact about the metric, and no page ranking for it says so. It means there is no agreed numerator, no agreed denominator and no agreed measurement window — so when a page tells you to shorten your time to value, nothing published survives a look at its method well enough to tell you what you are shortening it toward. Compare that with net revenue retention, where the same board specifies the cohort, the exclusions and the period, and independent surveys then report medians against that definition. One of those two metrics can be benchmarked. The other cannot, yet.
The one quoted figure, and the install base it came from
One number does exist. Userpilot’s product-adoption blog reports a time to value of 1 day, 12 hours and 23 minutes, attributing it to a benchmark study of 547 SaaS companies. The study Userpilot publishes with that sample is its Product Metrics Benchmark Report, dated 2024; the article citing the figure calls it the 2025 report. Neither states the period the data covers.
Four qualifiers travel with it, and all four matter more than the number:
- The sample is an install base, not a market. These are companies running a product-adoption tool. Buying software whose purpose is to shorten onboarding is itself evidence of a company that already invests in onboarding, so the sample leans toward products where activation is fast enough to be worth instrumenting.
- The measurement method is not published. The figure appears without a statement of which event opens the clock, which event counts as value, or how customers who never reached value were handled. Without those three, it cannot be reproduced.
- It is almost certainly an aggregate across products that each defined value for themselves. Nothing in the source says how the companies’ figures were combined or suggests a common value event was imposed — that reading is our inference, not a published statement. Either way, the middle of results measured on different definitions is not a measurement of anything in particular.
- Even its label is unstable. Userpilot’s article calls the figure a median. A third party republishing the same dataset presents 1d 12h 23m as the average, and gives the median as 1 day, 1 hour and 54 minutes. One number, two statistics, and no way to tell from the outside which it is — which is a stronger argument against using it as a target than anything we could add.
The industry breakdown Userpilot publishes alongside the figure makes the third point unarguable. Within one dataset, collected by one vendor in one period, the median moves by a factor of four:
| Vertical | Median time to value | In minutes |
|---|---|---|
| AI & machine learning | 16h 52m | 1,012 |
| Healthcare | 1d 7h 11m | 1,871 |
| FinTech & insurance | 1d 17h 11m | 2,471 |
| CRM & sales | 2d 8h 16m | 3,376 |
| MarTech | 2d 19h 22m | 4,042 |
| All companies | 1d 12h 23m | 2,183 |
Medians as published; the minute conversions are ours. The six-row source table also lists HR, whose median is published as N/A; the five verticals that have one are shown. The all-company row is the headline figure, placed here for comparison.
The slowest vertical’s median is 3.99 times the fastest one’s. A MarTech company that hits the all-company figure of 1d 12h 23m is well ahead of its own vertical’s 2d 19h 22m; an AI company that hits the same figure is more than twice as slow as its neighbours. The headline number tells neither of them anything.
The table’s own internal shape is the second reason not to lean on it. Times-to-event normally skew right, with a long tail pulling the mean above the middle, and in this table that happens in exactly one row of five: AI and machine learning, at a published mean of 1d 17h 19m against a median of 16h 52m, 2.4 times higher. Two rows lean the opposite way — CRM and sales at a mean of 1d 4h 43m against a median of 2d 8h 16m, MarTech at 1d 20h 47m against 2d 19h 22m. A mean sitting at half its own median is not a shape that elapsed time takes. The remaining two rows, healthcare and FinTech and insurance, publish a mean identical to the median down to the minute, twice in one table. Read together, those rows say the table describes its sample loosely, not that it is a scale to place yourself on.
That table also carries a fourth column of “safe ranges” — under two days for CRM and sales, under three for MarTech, under four for HR. It is worth naming, because it is the closest thing to a published threshold in the whole category and it is built on the sand above: same unpublished method, same install base, same self-defined value events, now rounded into advice. A range derived from a sample nobody can reproduce is not a benchmark, and treating it as one is how a made-up target ends up in a board deck.
Four definitions, and no agreement on where the clock starts
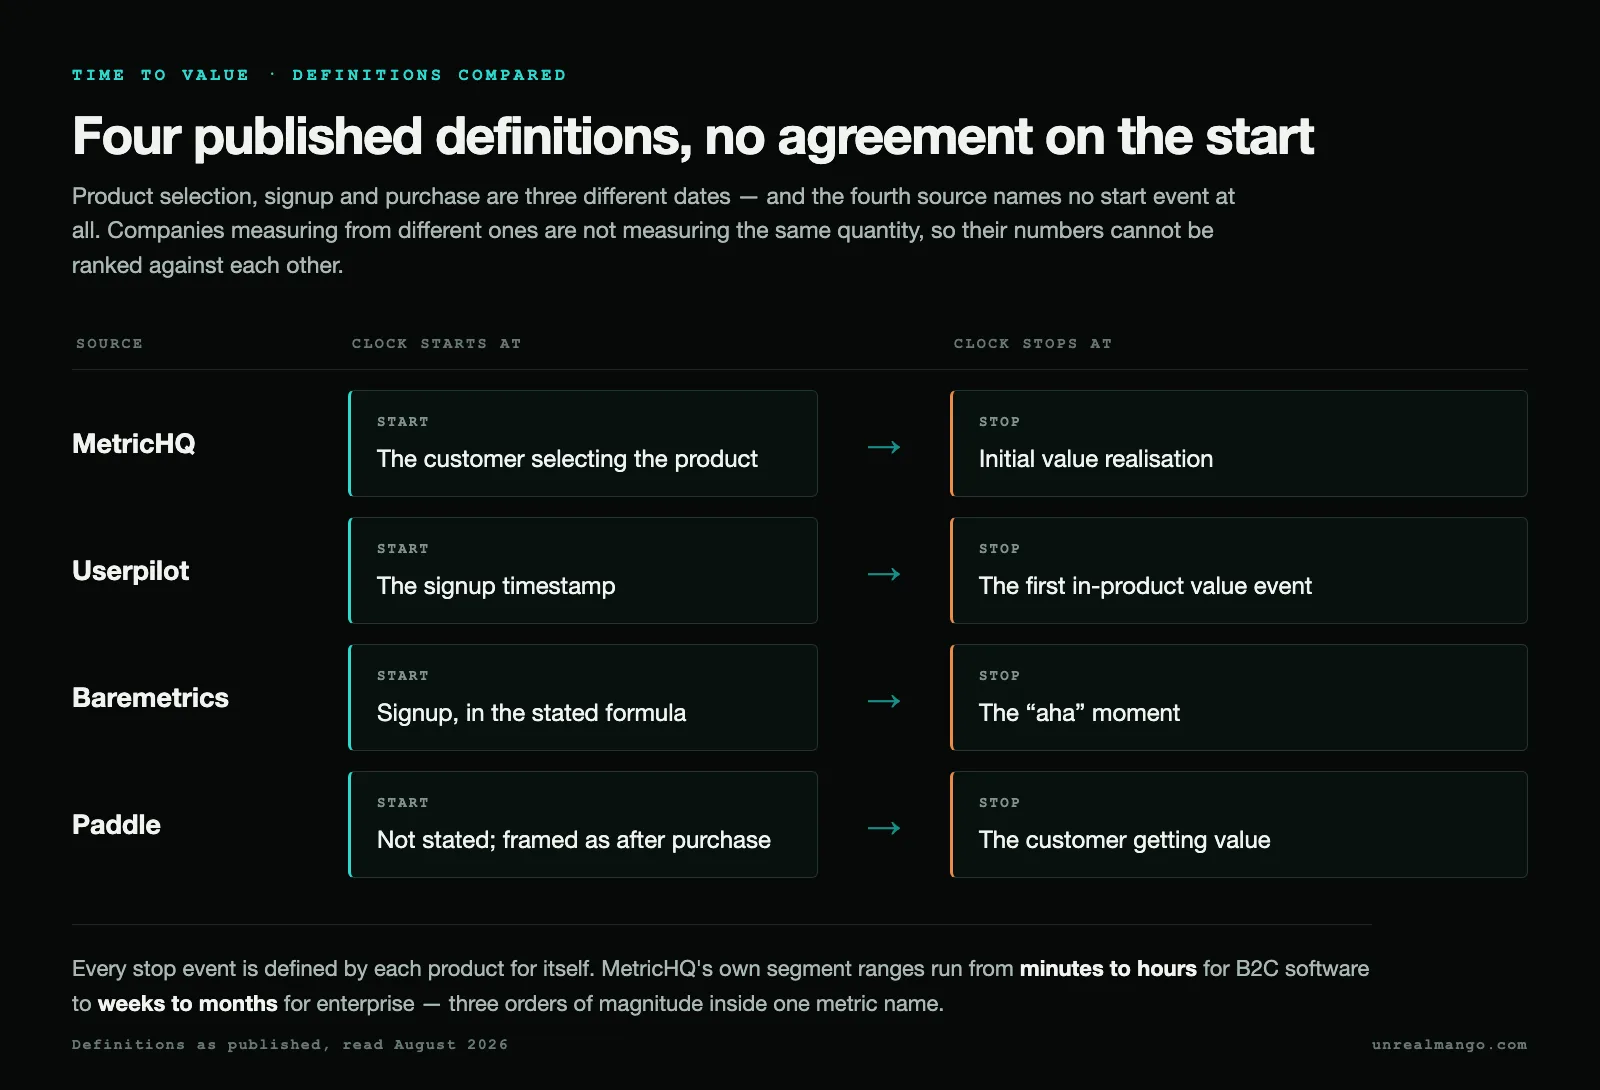
Even where the pages agree on the concept, they do not agree on when to press start. Four published definitions, compared on that one axis:
| Source | Clock starts at | Clock stops at |
|---|---|---|
| MetricHQ | The customer selecting the product | Initial value realisation |
| Userpilot | The signup timestamp | The first in-product value event |
| Baremetrics | Signup, in the stated formula | The “aha” moment |
| Paddle | Not stated; framed as after purchase | The customer getting value |
Product selection, signup and purchase are three different dates, and in enterprise software they can be months apart: a vendor is chosen in a committee meeting, signed weeks later after legal review, and provisioned after that. A company measuring from product selection and a company measuring from signup are not measuring the same quantity, so their numbers cannot be ranked against each other even if both are correct.
Paddle is the fourth case and a different kind of gap: it names no start event at all, framing the metric as what happens once the customer has paid. A definition that does not say where its clock starts cannot be reproduced either, and it is the most common shape in this category — most pages ranking for the term define the concept and skip the timestamp.
The stop events diverge too, and more consequentially, because value is defined by each product for itself. MetricHQ’s own segment ranges show what that does to the scale: minutes to hours for B2C software, days to weeks for small-business B2B SaaS, weeks for mid-market, and weeks to months for enterprise. That is a spread of three orders of magnitude inside one metric name.
The time to value formula, and the subset that flatters it
Written out, the calculation is one subtraction:
Time to value = timestamp of the first value event − timestamp of the start event
The arithmetic is not where the errors live. They live in the population you run it over, because a customer who has not yet reached value has no first-value timestamp to subtract from. The tempting fix is to leave those customers out and average the rest, and it breaks the metric in a specific, directional way.
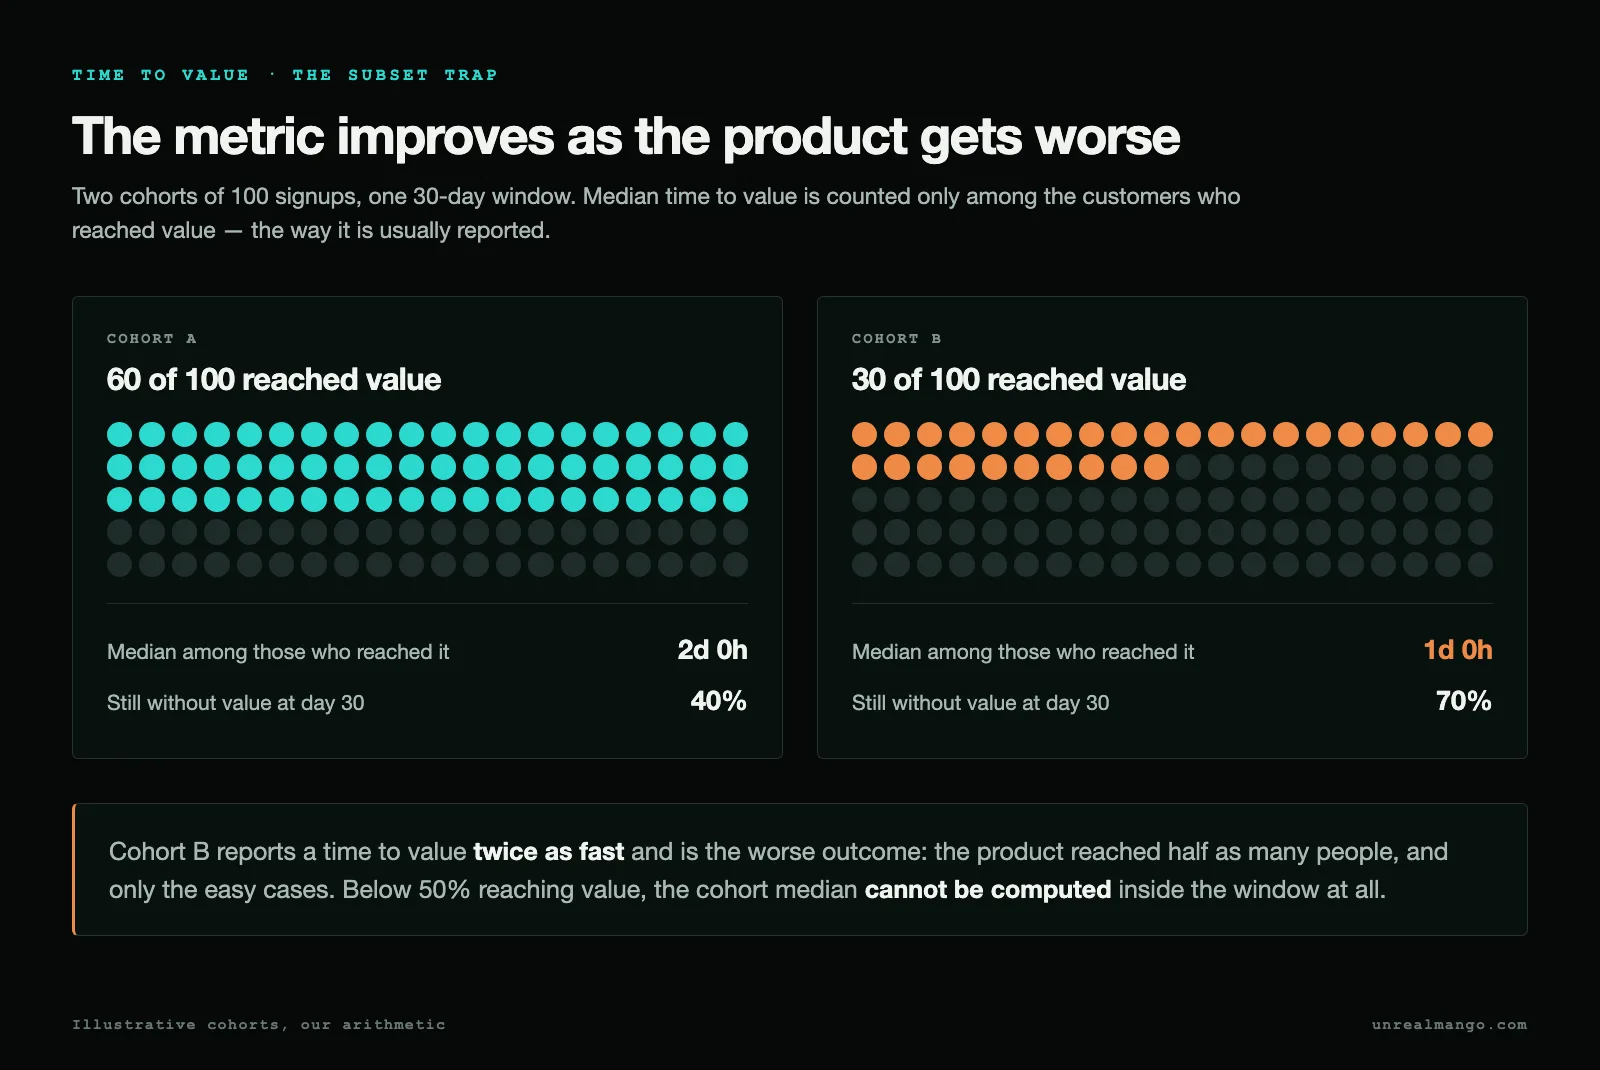
Take a cohort of 100 signups and a 30-day observation window.
| Cohort A | Cohort B | |
|---|---|---|
| Signups | 100 | 100 |
| Reached value within 30 days | 60 | 30 |
| Median time to value, among those who reached it | 2d 0h | 1d 0h |
| Share of the cohort still without value at day 30 | 40% | 70% |
Cohort B looks twice as fast. Cohort B is the worse outcome: the same product reached half as many people, and the ones it reached were the easy cases, so the median among survivors moved down because the slow cases never entered it. The mechanism is censoring rather than chance — the customers who drop out of the numerator are the ones who were going to take longest, so removing them can only pull the surviving median down. That is why the direction of the distortion is fixed: a subset median can never be biased slow. It is also invisible in the number itself — you cannot tell Cohort A from Cohort B without the second row.
There is a hard limit that follows from the same table. A median needs half the cohort to have experienced the event. In Cohort B only 30% did within the window, so the median time to value for that cohort cannot be computed at 30 days — it lies somewhere beyond the window, and any figure quoted for it is a figure for a subgroup, not the cohort.
A milder version of the same caution applies to Cohort A’s two days. Sixty per cent reached value, so a true cohort median does exist — but it is not two days. Two days is the middle of the sixty who succeeded, which is the thirtieth percentile of the hundred who signed up; the cohort median sits somewhere later. Every “median time to value” quoted anywhere, ours included, is a subset figure unless it says otherwise.
Setting your own threshold with a cohort and a fixed window
Since there is nothing reproducible to benchmark against, the working alternative is to benchmark against yourself. Four decisions, made once and written down:
- Name the value event, in the product’s own terms. Not “activated” — the specific action after which the customer has the outcome they came for: the first campaign sent, the first invoice reconciled, the first model deployed. If it cannot be logged with a timestamp, it cannot be the value event.
- Name the start event and stick to it. Signup is the usual choice in self-serve because both ends then sit in the same analytics. For sales-led products, contract start is more honest, since nothing the customer does before it is under their control.
- Fix the observation window before you look. Set it long enough that most of a normal cohort gets there — for a product whose users take days, 30 days is generous; for one whose users take weeks, a quarter. The window has to stay constant, or every comparison across quarters is contaminated.
- Report two numbers, never one. The share of the cohort reaching value inside the window, and the median time among those who did. The first stops the subset trap; the second is the speed you are actually trying to move.
Then compare each weekly or monthly signup cohort against your own previous ones. A cohort-over-cohort series answers the only question a benchmark could have answered — is this getting better — and it answers it about your product rather than someone else’s install base. It also connects to money in a way the industry median never could: a shorter, more reliable first result is the mechanism behind expansion revenue and the reason a shorter CAC payback period tends to accompany it.
Time to value vs time to market: different subject, different owner
The two get filed together because both sound like speed. They measure different subjects and belong to different teams.
| Time to market | Time to value | |
|---|---|---|
| Whose clock | The company’s | Each customer’s |
| Starts at | The decision to build | The customer’s start event |
| Ends at | The product being available to buy | That customer’s first result |
| How many completion dates | One, for the whole product | One per customer |
| Owned by | Product and engineering | Onboarding, support, product |
| Improved by | Cutting scope, shipping sooner | Removing steps between start and first result |
The distinction has a practical edge: the two can move in opposite directions from the same decision. Shipping earlier with fewer prebuilt integrations shortens time to market and lengthens time to value for every customer who now has to build the integration themselves. A launch that beats a competitor to the shelf and then takes each buyer three weeks to switch on has traded one metric for the other, and only one of them is visible in the launch announcement.
What shortens the number, and what only shortens the definition
Most published advice on shortening time to value is sound and repeated everywhere: cut setup steps, prefill what you can infer, get the customer’s own data in early, and let a person intervene where a product cannot. That is not the part worth adding to.
The part worth adding is the failure mode nobody writes about. Because each company defines its own value event, the fastest way to improve the metric is to move the definition closer to signup — counting “created an account and named a workspace” as value rather than “sent the first campaign”. Nothing about the customer’s experience changes. The chart improves anyway.
Two guardrails make the number honest:
- Freeze the value event before you measure, and treat a change to it as a break in the series. If it has to change, recompute prior cohorts under the new definition and say so in the report; a series that silently switches definitions mid-way is worse than no series at all.
- Publish the share reaching value alongside the time. A definition moved closer to signup lifts that share as well, which makes the manoeuvre visible instead of flattering.
Both guardrails are the same discipline that makes any adoption metric readable, and the reason time-to-value work belongs next to onboarding and lifecycle measurement rather than inside a launch plan. It is also the metric that product-led growth models lean on hardest, since a product that has to sell itself has only the customer’s first session to do it in.
For teams building that measurement into a SaaS funnel rather than a slide, our SaaS marketing and growth work starts from the same place: the event definitions first, the dashboard second.
08 / Reader questions
Frequently asked questions
01What is the time to value formula?
Time to value is the timestamp of a customer's first value event minus the timestamp that starts their clock, usually signup. Baremetrics writes it as date of first value minus date of signup. The formula is trivial; the two definitions it depends on are not, and they are what make one company's number incomparable with another's.
02What is a good time to value?
There is no defensible answer. No standards body defines the metric, and the one vendor table that prints safe ranges by industry derives them from an install base whose measurement method is not published. The SaaS Metrics Standards Board standardises eleven B2B SaaS metrics and time to value is not among them. A good time to value is one falling against your own prior cohorts, measured the same way each time.
03What does time to value mean?
It means the elapsed time between a customer starting with a product and the moment they get the first result they came for. The result is product-specific: a sent campaign, a reconciled ledger, a deployed model. The phrase carries no fixed unit, which is why published figures range from minutes to months.
04What is an example of time to value?
A team signs up for an analytics tool on Monday morning, connects a data source that afternoon and sees its first dashboard populate on Tuesday: a time to value of about one day. If the same team needs a data engineer to finish a migration first, the same product has a time to value of several weeks for that customer.
05Is there a time to value calculator?
A calculator adds nothing here, because the arithmetic is one subtraction. What decides the number is which event you count as the start, which event counts as value, and how you treat the customers who never reached it. Fix those three choices and a spreadsheet with two timestamp columns is enough.
06What is the difference between time to value and time to market?
Time to market measures your company's clock, from the decision to build to the product being available. Time to value measures each customer's clock, from their start to their first result. One has a single completion date for the whole product; the other has one per customer, and they are not the same distribution.
07What is time to value in SaaS?
In SaaS it is usually measured from signup to a first in-product value event, because both timestamps sit in the product's own analytics. Userpilot reports 1 day, 12 hours and 23 minutes from a benchmark study of 547 SaaS companies — a description of that install base, not a target for yours, and a figure published elsewhere as an average rather than a median.