
Published
A good ROAS is 2x to 4x by the convention repeated on every page of the US first result page we checked, and the two largest published datasets show that the band describes one channel and not the other: the 2025 median is 1.86x on Meta across roughly 35,000 brands and 3.68x on Google across more than 18,000. Meta’s median falls below the floor of the band entirely. It is a market average, not a pass mark. Your pass mark is your break-even, and it is higher than the formula in circulation says.
How this was checked. In August 2026 we pulled every organic result and the AI Overview Google returned in the United States for “what is a good roas”, then read each ranking page for the number it gives, the dataset behind it and whether it accounts for returns. Platform benchmarks below come from Triple Whale’s published 2025 datasets (about 35,000 brands on Meta, over 18,000 on Google, calendar year), Amazon Ads’ own guidance, the National Retail Federation’s 2025 Retail Returns Landscape, and two peer-reviewed field experiments. Every figure carries its window and its sample, because on this topic both decide the answer.
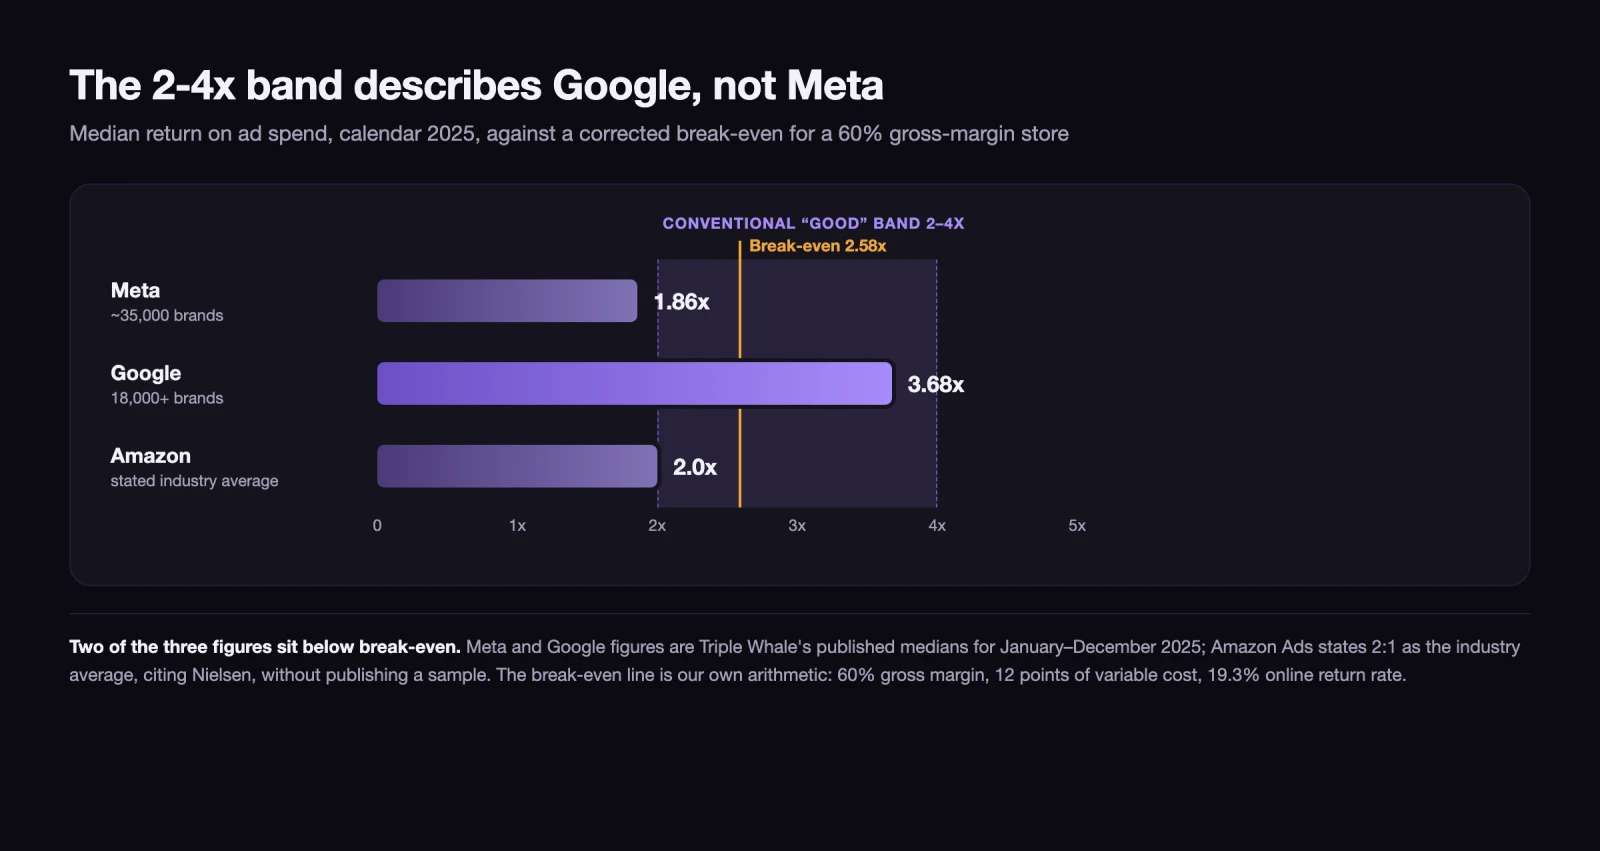
The rule of thumb is 2-4x, the median Meta advertiser is at 1.86x
Google’s AI Overview, Amazon Ads and almost every article on page one land on the same band: a good ROAS is 2:1 to 4:1. None of the pages that quote it says where the median actually falls.
Triple Whale, which sees spend and revenue together for Shopify brands, published both medians for calendar 2025.
| Channel | Median ROAS 2025 | 2024 | Change | Brands in dataset |
|---|---|---|---|---|
| Meta | 1.86x | 1.84x | +1.29% | ~35,000 |
| 3.68x | 4.09x | -10.03% | 18,000+ |
Two things follow that the 2-4x band hides.
The first is that the band is really a Google band. Google’s 3.68x sits comfortably inside it; Meta’s 1.86x sits below the floor. Search advertising catches demand that already exists, social advertising interrupts it, and the gap between the two channels is roughly a factor of two across two overlapping samples of the same kind of merchant. Quoting one number for both is the single most common mistake in this topic.
The second is direction. Meta’s median barely moved year on year, up 1.29%, while its CPM rose 20.03% to $14.19 and its click-through rate rose 13.5% to 2.19%. Google’s median fell 10.03%, with cost per acquisition up 12.35% to $23.74 and conversion rate down 9.28%. A target you set from a 2023 article is being measured against a market that has moved underneath it.
ROAS in one line, and the three versions of it people mean
Return on ad spend is revenue divided by the advertising cost that produced it. Spend $2,000, book $6,000, and your ROAS is 3, written 3x or 3:1 or 300%. That is the whole formula, and the arguments are never about it.
They are about which revenue and which spend go into it, and there are three answers in common use:
- Platform ROAS — revenue the ad platform credits itself with, divided by spend on that platform. This is what you see in Ads Manager. It is the most optimistic of the three, for reasons the last two sections of this page are about.
- Blended ROAS — total revenue from every source, divided by total advertising spend. Nothing can be double-counted because there is only one denominator and one numerator. Its weakness is the mirror image: it credits paid media with organic and repeat sales too. Most of the industry calls the same calculation MER, the marketing efficiency ratio, usually over total marketing spend rather than ad spend alone — though Triple Whale defines its own MER the other way up, as spend over revenue, so check which one a dashboard means before comparing.
- New-customer ROAS — revenue from first-time buyers only, divided by total ad spend. Triple Whale defines it as new customer order revenue over blended ad spend and abbreviates it NC ROAS. It answers the question the other two dodge: is the money actually buying customers, or re-buying the ones you had.
A brand running all three sees three different numbers for the same month, and none of them is wrong. They answer different questions. Decide which question you are asking before you decide whether the answer is good.
ROAS benchmarks by channel, with the sample size behind each one
| Channel | Benchmark | What it was measured on | Window |
|---|---|---|---|
| Meta | 1.86x median | ~35,000 brands (Triple Whale) | Jan-Dec 2025 |
| 3.68x median | 18,000+ brands (Triple Whale) | Jan-Dec 2025 | |
| Amazon | 2:1 average, 3-4x suggested target | Nielsen US benchmarking study, cited by Amazon Ads | not stated by Amazon |
Three caveats travel with that table.
The Meta and Google figures come from the same vendor’s panel of Shopify merchants, though the two samples are different sizes and not identical. That makes them unusually comparable to each other and less applicable to anyone outside direct-to-consumer retail. A B2B advertiser selling a $40,000 contract has no business benchmarking against them.
Amazon’s 2:1 is the softest figure here. Amazon Ads presents it as the current industry average and attributes it to Nielsen’s US benchmarking work without publishing the sample or the year. Treat it as an order of magnitude. Amazon also reports the same result as ACOS, advertising cost of sale, which is simply the inverse as a percentage: 4x ROAS is 25% ACOS, 2x is 50%. If a marketplace agency quotes you one and your dashboard shows the other, nothing has gone wrong.
There is no comparable public median for TikTok, LinkedIn or programmatic display on a dataset of this size. Numbers do circulate — 1.4x for TikTok is the one most often repeated — but they trace back to secondary blog posts rather than a published dataset, and we are not going to launder them by repeating them here.
ROAS benchmarks by industry, on ~35,000 Meta advertisers
Meta is where the industry table is actually published in full. Every figure below is the 2025 median for that vertical in Triple Whale’s dataset.
| Industry | Meta ROAS 2025 | Meta CPA 2025 |
|---|---|---|
| Automotive | 2.54x | $34.15 |
| Sports & Outdoors | 2.28x | $43.89 |
| Travel Accessories & Luggage | 2.25x | $48.37 |
| Apparel & Accessories | 2.18x | $36.76 |
| Home & Garden | 2.18x | $46.46 |
| Baby | 2.17x | $30.04 |
| Toys, Art & Collectibles | 1.93x | $34.87 |
| Lifestyle & Boutique | 1.93x | $29.99 |
| Electronics | 1.92x | $49.48 |
| Books & Music | 1.65x | $30.25 |
| Pets & Animals | 1.58x | $38.18 |
| Beauty | 1.57x | $37.92 |
| Food & Beverage | 1.56x | $38.15 |
| Health & Wellness | 1.50x | $38.55 |
| Media & Publishing | 1.17x | $33.78 |
The spread from top to bottom is 2.17 times: automotive at 2.54x against media and publishing at 1.17x. Nine of the fifteen verticals sit below 2.0x, which is the floor of the band the whole internet calls good, and not one of them reaches 3x.
Notice that ROAS and cost per acquisition do not move together. Lifestyle and boutique has the cheapest acquisition on the board at $29.99 and a middling 1.93x; electronics has the most expensive at $49.48 and a similar 1.92x. That is average order value doing the work, and it is the reason cost per acquisition alone tells you nothing about profitability — a point worth holding onto if you have ever compared what a Google Ads click costs against a competitor’s and drawn a conclusion.
Google’s equivalent table is only partly public. The four verticals Triple Whale published are pets and animals at 2.84x, up 2.51%; travel accessories and luggage at 4.30x, down 21.10%; consumer electronics at 3.02x, down 11.45%; and health and wellness at 2.12x, down 15.64%. Return on ad spend fell in 13 of the 14 industries they track, pets being the only riser.
Break-even ROAS: the formula everyone publishes leaves out two costs
Every page on the first result page, including Google’s AI Overview, gives the same formula:
Break-even ROAS = 1 ÷ profit margin
With a 20% margin that produces 5:1, with a 75% margin 1.33:1. It is arithmetically correct and practically wrong, because the margin it asks for is not a margin any retailer actually keeps.
Two costs are missing.
Variable costs that are not cost of goods. Payment processing is the easiest to price because it is published: Stripe’s standard US rate for online card payments is 2.9% plus $0.30 per successful transaction, with an extra 1.5% for international cards and a further 1% where currency conversion is involved. Add pick, pack and outbound shipping. On a physical product these routinely total 10 to 15 points of order value, and none of them appear in a gross margin calculated from cost of goods alone.
Returns. The National Retail Federation’s 2025 Retail Returns Landscape puts total US returns at $849.9 billion, 15.8% of annual retail sales, against 16.9% and $890 billion in 2024. For online sales specifically the figure is 19.3%. The report draws on two summer-2025 surveys: 2,006 consumers who had returned at least one online purchase in the previous twelve months, and 358 ecommerce professionals at US merchants with over $500 million in revenue.
Returns matter to this arithmetic in a way that is easy to miss. A returned order gives the revenue back, but it does not give the ad spend back. You paid to acquire a sale that unwound. Your ad platform, meanwhile, is very unlikely to have removed it from the ROAS it reports.
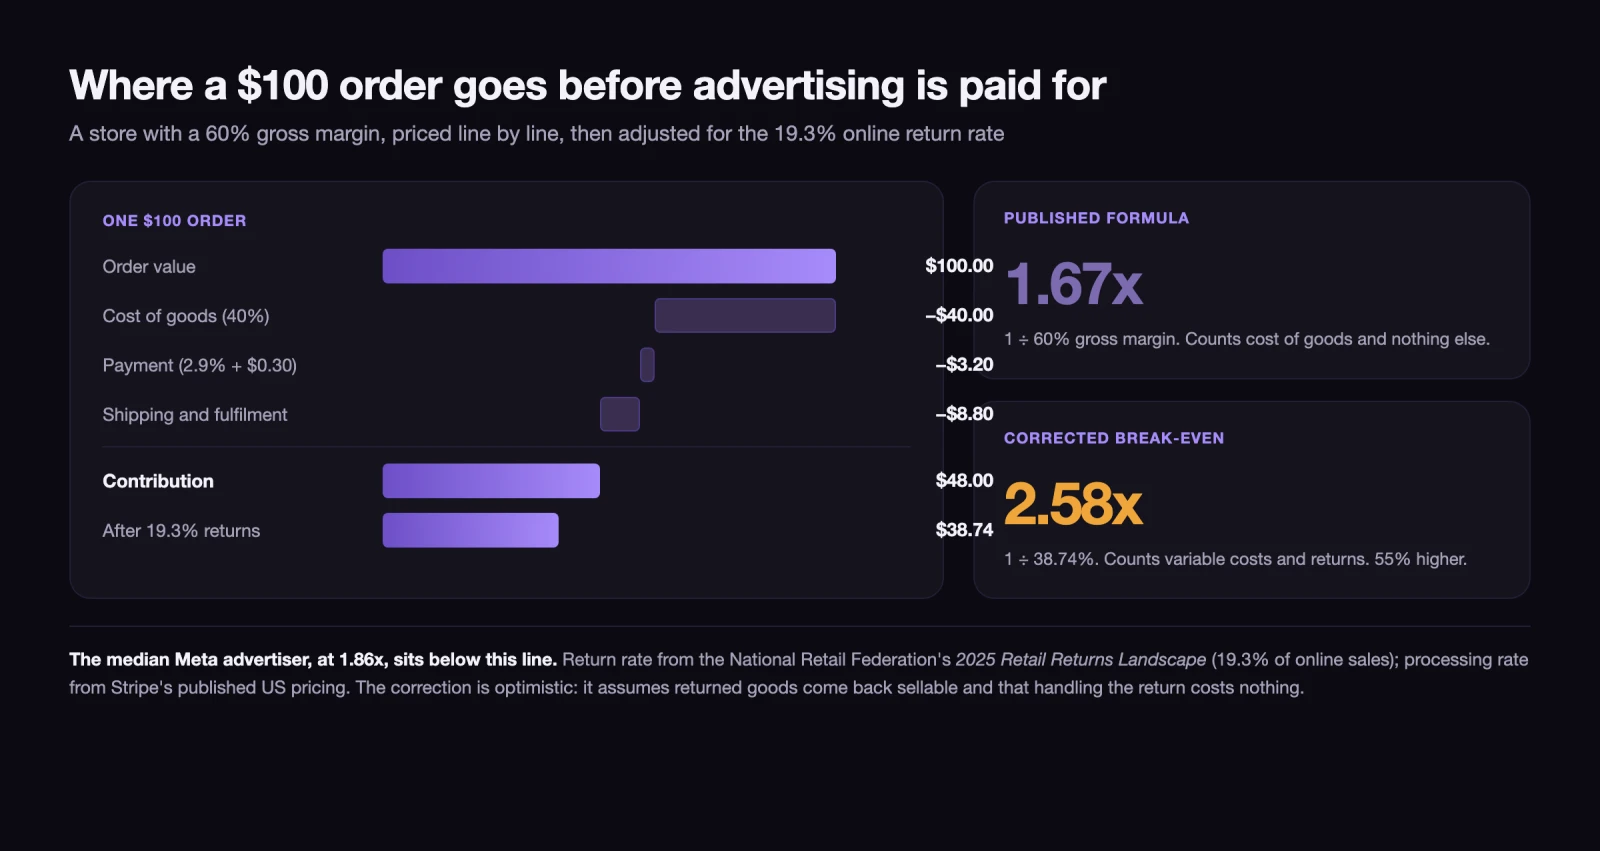
The corrected break-even, worked on a $100 order
Take a store with a 60% gross margin, the margin most people would put into the standard formula.
| Line | Amount | Running total |
|---|---|---|
| Order value | $100.00 | $100.00 |
| Cost of goods (40%) | -$40.00 | $60.00 |
| Payment processing (2.9% + $0.30) | -$3.20 | $56.80 |
| Shipping and fulfilment | -$8.80 | $48.00 |
| Contribution before advertising | $48.00 |
Contribution margin is 48%, not 60%. Break-even ROAS on that alone is 1 ÷ 0.48, which is 2.08x rather than the 1.67x the standard formula gives.
Now apply returns. If 19.3% of revenue comes back, then $100 of reported revenue leaves $80.70 that sticks, and contribution on it is $38.74. Break-even ROAS is 1 ÷ 0.3874, or 2.58x.
That is 55% higher than the 1.67x the published formula produces for the same business. And it changes the verdict on the benchmark: the median Meta advertiser, at 1.86x, is below break-even for this cost profile. Not below target. Below the point where the spend pays for itself.
The correction is conservative, incidentally. It assumes returned goods come back sellable, that processing the return is free, and that the payment fee and outbound shipping come back with the order. None of the three is usually true — Stripe does not refund its 2.9% when you refund the customer — so treat 2.58x as the optimistic end.
| Gross margin | Contribution after 12 points of variable cost | Standard formula | Corrected, with 19.3% returns |
|---|---|---|---|
| 30% | 18% | 3.33x | 6.88x |
| 40% | 28% | 2.50x | 4.43x |
| 50% | 38% | 2.00x | 3.26x |
| 60% | 48% | 1.67x | 2.58x |
| 70% | 58% | 1.43x | 2.14x |
| 80% | 68% | 1.25x | 1.82x |
The 20% row is missing on purpose. At a 20% gross margin, 12 points of variable cost leave 8 points of contribution and a break-even near 15.5x, which is not a target — it is the arithmetic telling you that this product cannot be sold profitably through paid acquisition at all. The 20%-margin case, where the standard formula returns a comfortable-looking 5:1, is exactly where it is most badly wrong.
Run your own row rather than borrowing one. Your return rate is knowable from your own order data, and it is the input with the widest spread between categories: apparel and footwear run far above 19.3%, groceries and consumables far below.
From break-even to a target you can actually bid on
Break-even is the floor. Your target is the floor plus the contribution you intend to keep.
If break-even is 2.58x and you want to keep 15 cents of contribution per revenue dollar after advertising, you are solving for the ROAS where contribution minus ad cost equals 15% of revenue. At a 38.74% post-returns contribution rate, that is 1 ÷ (0.3874 - 0.15), or 4.21x. Wanting to keep 20 cents pushes it to 5.34x. The relationship is not linear, and it gets brutal fast — which is why “just raise the target” is rarely the answer to a thin quarter.
Two practical notes on entering that number.
Google Ads takes target ROAS as a percentage, not a ratio. Google’s own example is unambiguous: “Your goal is $5 USD worth of sales (this is your conversion value) for each $1 USD you spend on ads. You’d set a target ROAS of 500%.” A 4.21x target is entered as 421%. Typing 4.21 sets a target of 4.21%, and the campaign will spend as though nothing matters.
The bid strategy has conversion minimums. Google requires at least 15 conversions in the past 30 days for Search and Shopping campaigns, at least 30 in 30 days for Video Action, at least 50 in the past 35 days for Demand Gen with 10 of those in the past 7, and 10 a day for App campaigns. Below those thresholds target ROAS has nothing to learn from, and setting it is worse than leaving it off.
ROAS and ROI are not the same number, and the gap is your margin
These two get used interchangeably in conversation and they are not close.
ROAS divides revenue by ad spend. ROI divides profit by total cost. On the same campaign the two answers can sit on opposite sides of zero.
Take the $100 order above at a 3x ROAS. Spend $33.33, book $100 of revenue, keep $48.00 of contribution before advertising. Profit is $48.00 - $33.33 = $14.67, so ROI on the ad spend is 44%. Now run the same 3x on the 30% gross margin business, where contribution is 18 points: $18.00 of contribution against $33.33 of spend is a loss of $15.33, an ROI of -46%. Identical ROAS, opposite outcomes.
The shortcut worth memorising: ROAS multiplied by your contribution margin rate is what you actually keep per advertising dollar. Above 1, you are ahead. Use the post-returns rate, or you will reproduce the too-low break-even this page has just spent a section correcting: at 3x and the 38.74% post-returns rate that is 1.16, and at 3x and the 30% gross-margin store’s 14.5% it is 0.44. The whole of the margin argument fits in that one multiplication.
Why platform ROAS adds up to more revenue than you banked
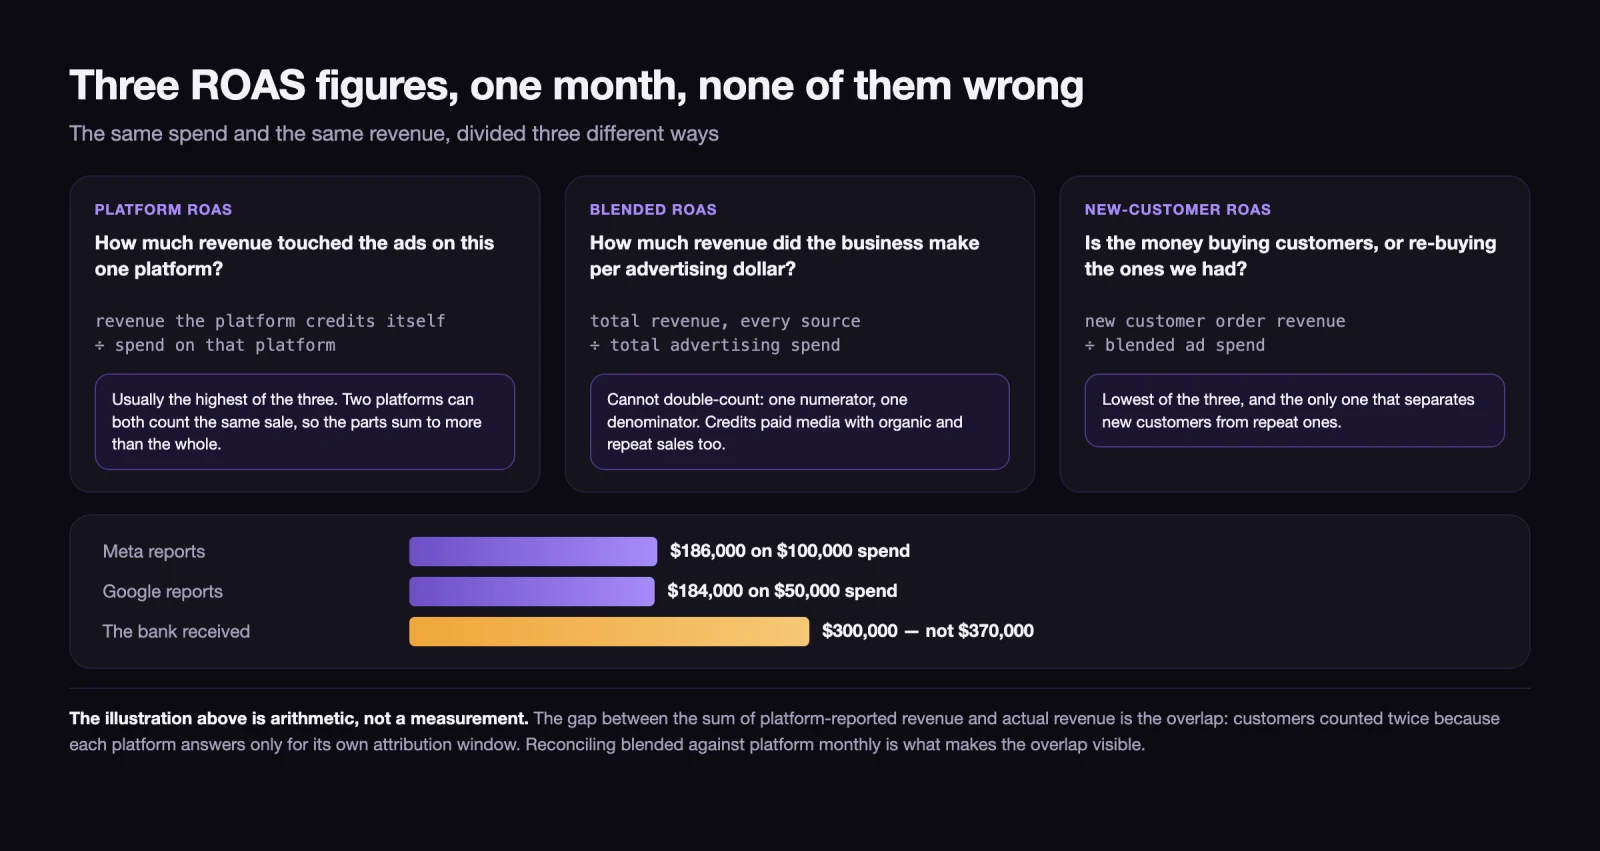
Add up the revenue Meta claims and the revenue Google claims for the same month, and the total will usually exceed what your bank actually received. Neither platform is lying. Each is answering “how much revenue touched my ads” inside its own attribution window, and a customer who saw an Instagram ad on Tuesday and searched your brand name on Thursday is counted by both.
This is why blended ROAS and MER exist, and why the reconciliation is worth doing monthly rather than never: total revenue divided by total advertising spend cannot double-count, because there is only one of each. If your blended figure is far below the weighted average of your platform figures, the gap is the overlap.
The same reconciliation catches the other common inflation, which is credit for demand that already existed. Retargeting and branded search both report beautifully and both spend most of their budget on people who were arriving anyway. If you have ever wondered why a campaign with a 12x reported ROAS did not move total revenue when you scaled it, that is the reason, and server-side conversion tracking improves the data quality without touching the underlying attribution problem.
What happened when two teams measured advertising properly
The reported number is an observational estimate. Two published field experiments compared observational measurement with randomised measurement on very large samples, and both found the observational figure flattering.
Facebook’s own data, 15 experiments. Gordon, Zettelmeyer, Bhargava and Chapsky published A Comparison of Approaches to Advertising Measurement: Evidence from Big Field Experiments at Facebook in Marketing Science (2019, vol. 38, no. 2, pp. 193-225). They took 15 large-scale advertising campaigns run as randomised controlled trials on Facebook’s own experimentation platform in 2015 — roughly 500 million user-experiment observations and 1.6 billion impressions — then re-estimated the same effects with six standard observational methods. The observational estimates frequently failed to reproduce the experimental ones even with extensive demographic and behavioural controls, and in around half the studies the divergence was on the order of a factor of three. In one checkout study the true lift was 73% while observational methods returned anywhere from 37% to 222%.
eBay, brand keywords. Blake, Nosko and Tadelis published Consumer Heterogeneity and Paid Search Effectiveness: A Large-Scale Field Experiment in Econometrica (2015, vol. 83, no. 1, pp. 155-174). Switching off brand-keyword paid search recaptured 99.5% of the lost paid clicks through organic search almost immediately — the traffic did not disappear, it simply stopped being paid for. For non-brand keywords they suspended advertising in 68 of 210 US media markets for 60 days in 2012 and measured a return on investment of -63%, with a 95% confidence interval from -124% to -3%.
Neither study is a reason to stop advertising, and neither generalises cleanly to a small brand nobody searches for by name. eBay is an extreme case precisely because its brand demand was enormous. What they establish is narrower and more useful: the number in your dashboard is an upper bound, and the gap between it and the incremental truth is largest exactly where the reported number looks best.
The practical version is cheap. Turn one campaign off in a defined region or audience for a fortnight, hold everything else steady, and compare total revenue rather than platform-reported revenue. That is a worse experiment than either of the two above and still better than trusting the dashboard.
Campaign stage moves the number more than industry does
A single target applied across a campaign’s life will be wrong at both ends.
| Stage | What the spend is buying | Where ROAS sits | What to judge instead |
|---|---|---|---|
| Learning, first 2-4 weeks | Conversion data for the bid algorithm | Below break-even, often far below | Volume of conversions, not efficiency |
| Scaling | Incremental customers at rising cost | Falling as budget rises | Whether blended ROAS holds while spend grows |
| Steady state | Repeatable acquisition | At or above target | Contribution after ad spend, in dollars |
| Harvesting | Demand that already exists | Highest reported, lowest incremental | Total revenue when you pause it |
The counterintuitive row is the last one. The highest reported ROAS in an account is nearly always its least valuable spend, because branded search and retargeting harvest intent rather than create it. An account optimised purely to raise reported ROAS will drift toward that spend and shrink.
The scaling row carries the practical rule: ROAS falls as budget rises, nearly always, because you buy the cheapest conversions first. A campaign that returns 4x on $5,000 a month will not return 4x on $50,000, and treating the decline as a failure of execution rather than as arithmetic is how good campaigns get killed. Rising frequency is the mechanism by which it happens, and it is worth knowing how long a creative lasts before you blame the targeting.
A good ROAS when there is no order value
Everything above assumes revenue lands at the moment of conversion. For lead generation, professional services and anything with a sales cycle, it does not, and ROAS calculated on the ad platform’s conversion value is meaningless because that value was assigned by you.
The substitute is to work backwards from a closed deal. Take the average contribution of a won client, multiply by your lead-to-close rate, and you have the true value of a lead. That figure divided by your cost per lead is your real ROAS, and it will be available three to nine months after the spend rather than the same afternoon.
Two consequences follow. The first is that the number in the dashboard on Monday is a proxy at best, and the useful measurement is a cohort one — spend from March judged in September. The second is that lifetime value, not first-order value, is the correct numerator wherever customers buy again; the mechanics of that calculation sit in the customer lifetime value formula, and getting it wrong is the most common reason a profitable account looks unprofitable.
If working out which of these numbers your account should actually be managed against is the problem, that is the sort of thing our paid media team does before touching a bid.
Every figure on this page, with its dataset and window
| Figure | Source | Measured on | Window |
|---|---|---|---|
| Meta 1.86x, industry table, CPA figures | Triple Whale | ~35,000 brands | Jan-Dec 2025 |
| Google 3.68x, 4 industry rows | Triple Whale | 18,000+ brands | Jan-Dec 2025 |
| Amazon 2:1 average | Amazon Ads, citing Nielsen | not published | not stated |
| 15.8% total return rate, 19.3% online | NRF, 2025 Retail Returns Landscape | 2,006 consumers; 358 merchant professionals | summer 2025 |
| 2.9% + $0.30 processing | Stripe published pricing | US online domestic cards | current at August 2026 |
| Target ROAS as a percentage; conversion minimums | Google Ads Help | Google’s own documentation | current at August 2026 |
| Observational vs experimental divergence | Gordon et al., Marketing Science 38(2), 193-225 | 15 RCTs, ~500M observations | experiments 2015, published 2019 |
| Brand search 99.5% recapture; -63% non-brand ROI | Blake, Nosko & Tadelis, Econometrica 83(1), 155-174 | 68 of 210 US markets, 60 days | experiment 2012, published 2015 |
Break-even and target calculations are our own arithmetic on the stated inputs, not survey findings. The email equivalent of this exercise — a benchmark that everyone quotes and almost nobody adjusts for how it is measured — is covered in what a good email open rate actually is.
14 / Reader questions
Frequently asked questions
01What is a good ROAS?
The convention is 2x to 4x, and the largest published datasets show most advertisers below the top of it. Triple Whale's 2025 figures put the median at 1.86x on Meta across roughly 35,000 brands and 3.68x on Google across more than 18,000. A good ROAS for you is any figure above your own break-even, which depends on margin, variable costs and returns rather than on the convention.
02Is a 2x ROAS good?
It is above the 2025 Meta median of 1.86x and below the Google median of 3.68x, so the honest answer is that it depends entirely on your costs. A store with a 60% gross margin, 12 points of variable cost and an average return rate breaks even near 2.58x, so 2x loses money there. A software business with almost no cost of delivery profits at 2x comfortably.
03Is a 4x ROAS good?
Only above roughly a 43% gross margin, on the arithmetic below. At a 60% gross margin with 12 points of variable cost and an average return rate, break-even is 2.58x, so 4x leaves about 14 cents of contribution per revenue dollar after ad spend. At a 40% gross margin break-even is 4.43x and 4x is a loss, so the answer is not the automatic yes it is usually given.
04Is a 10x ROAS good?
It is well above every published benchmark, which is why it is worth checking before celebrating. Very high reported ROAS usually means the campaign is being credited with sales that would have happened anyway, most often branded search or retargeting of people already on their way to buy. Check it against total revenue rather than against the platform's own number.
05What is a good ROAS for ecommerce?
Around 2x on Meta and 3.5x to 4x on Google as a market reference point, using Triple Whale's calendar-2025 medians of 1.86x and 3.68x. Within Meta the industry spread runs from 1.17x in media and publishing to 2.54x in automotive. Compare against your own break-even before treating any of these as a target.
06What is a good ROAS for Google Ads?
The median across more than 18,000 brands running Google Ads was 3.68x in 2025 in Triple Whale's dataset, down 10.03% from 4.09x in 2024. Google itself publishes no such figure. Search converts higher than social because the intent is already there, so a Google target sits above a Meta one on the same product. Note that Google Ads takes target ROAS as a percentage: 3.68x is entered as 368%.
07What is a good ROAS on Amazon?
Amazon Ads publishes 2:1 as the industry average, citing Nielsen's US benchmarking study, and suggests aiming closer to 3 or 4. Amazon also reports the same result as ACOS, which is the inverse expressed as a percentage: a 4x ROAS is a 25% ACOS. The two numbers never disagree, they are the same division read from opposite ends.
08What is a good break-even ROAS?
There is no good break-even, only yours: it is the point where contribution margin exactly covers ad spend. Divide 1 by your contribution margin rate, then divide again by 1 minus your return rate. At a 60% gross margin, 12 points of variable cost and a 19.3% return rate, that is 2.58x rather than the 1.67x the usual formula gives.