Published
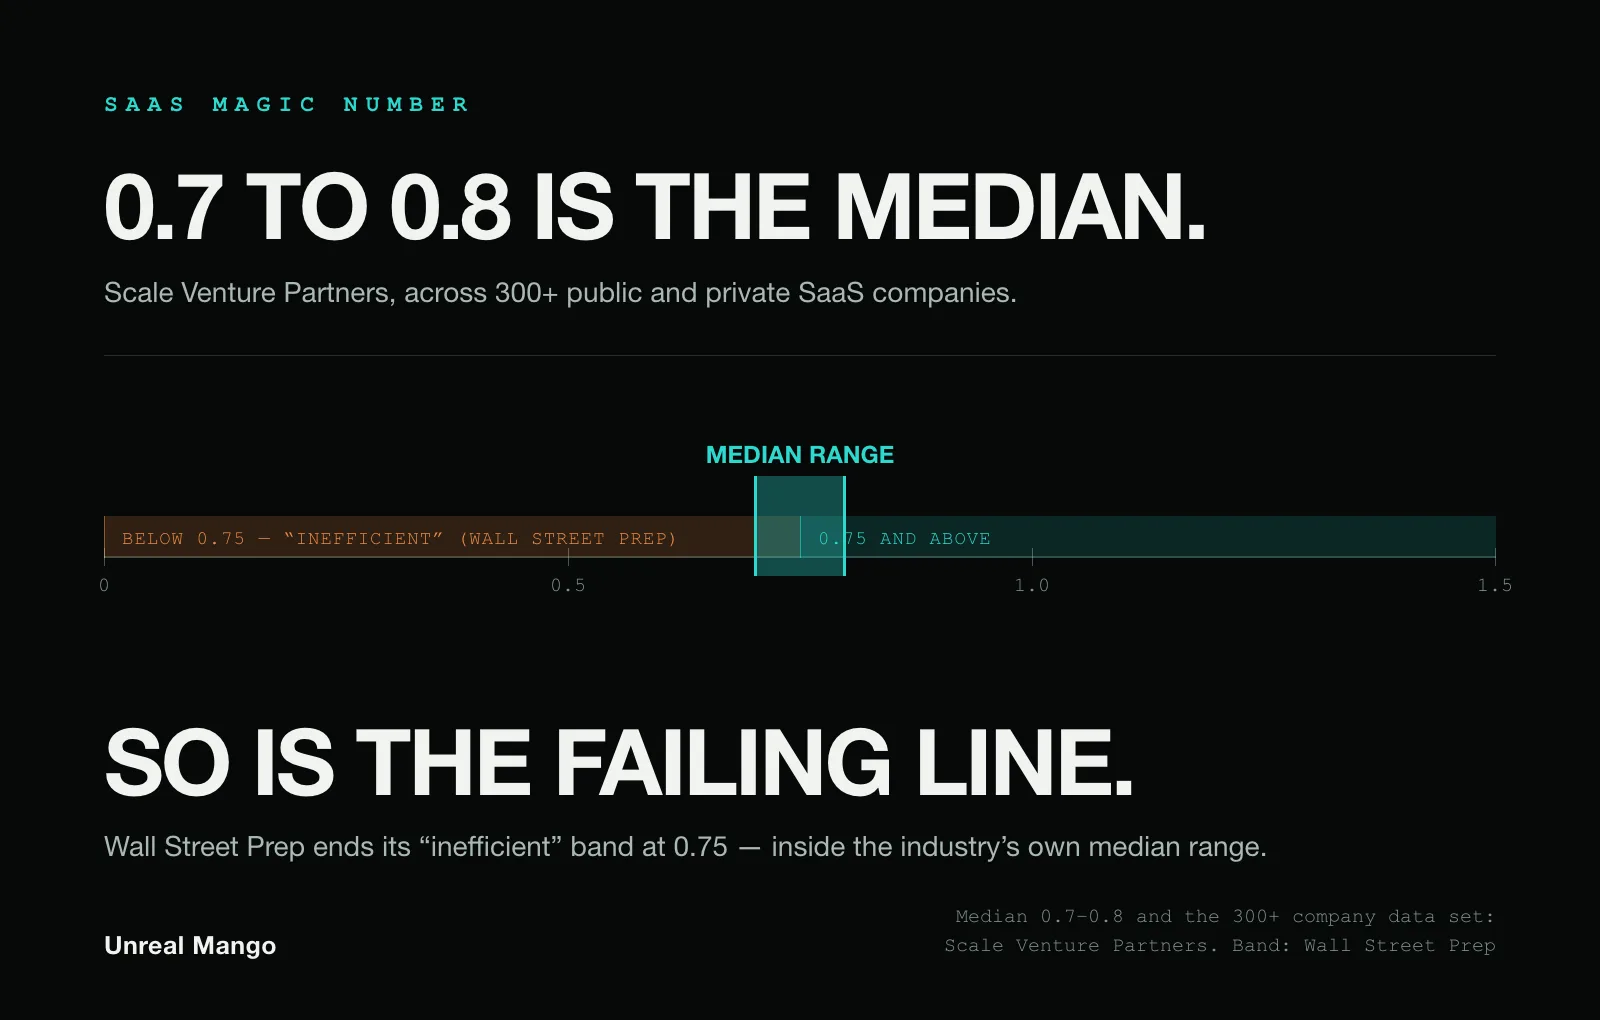
The SaaS magic number is net new annual recurring revenue divided by the previous quarter’s sales and marketing spend — how much new recurring revenue each go-to-market dollar buys. Scale Venture Partners, whose partner coined it in 2005, puts a healthy baseline at 0.7, not the 1.0 that most published tables imply.
How this was checked. In August 2026 we set the published definitions side by side: Rory O’Driscoll’s original 2010 statement of the formula and Dale Chang’s 2020 history of it, both at Scale Venture Partners; ICONIQ Growth’s ARR-based version; and the interpretation tables on the pages currently ranking for this term. Where sources disagree, the disagreement is shown rather than resolved. Every worked figure below is ours, illustrative, and stated in full so the arithmetic can be checked. Where a claim is our inference rather than a published finding, it says so.
The one structural fact worth carrying into everything below: this is a period metric. It compares one calendar quarter’s revenue movement with another calendar quarter’s spend. It does not follow a cohort of customers through time the way net revenue retention does. Almost every way the magic number misleads is a consequence of that single design choice.
Five published methods, four different answers, one quarter
O’Driscoll stated the original in one sentence in 2010: “Take the change in subscription revenue between two quarters, annualize it (multiply by four), and divide the result by the sales and marketing spend for the earlier of the two quarters.”
ICONIQ Growth states the ARR form without the annualisation, because ARR is already annual: “Net Magic Number = Current Q Net New ARR / Prior Q S&M OpEx.”
Those two agree, as long as subscription revenue is the only revenue. They stop agreeing the moment anything else is in the reported line. Take one company through a single quarter:
- Q1 subscription revenue $4.0m, Q2 subscription revenue $4.6m
- Q2 gross new ARR $3.2m, churn and contraction $0.8m, so net new ARR $2.4m
- Total GAAP revenue including professional services: Q1 $4.5m, Q2 $5.0m
- Sales and marketing spend: Q1 $2.0m, Q2 $2.2m; gross margin 76%
| Method | Calculation | Result |
|---|---|---|
| Gross new ARR ÷ prior-quarter S&M | $3.2m ÷ $2.0m | 1.60 |
| Net new ARR ÷ prior-quarter S&M | $2.4m ÷ $2.0m | 1.20 |
| Subscription revenue delta × 4 ÷ prior-quarter S&M | ($4.6m − $4.0m) × 4 ÷ $2.0m | 1.20 |
| Total GAAP revenue delta × 4 ÷ prior-quarter S&M | ($5.0m − $4.5m) × 4 ÷ $2.0m | 1.00 |
| Net new ARR × gross margin ÷ prior-quarter S&M | $2.4m × 0.76 ÷ $2.0m | 0.91 |
Our arithmetic on illustrative figures, not a benchmark. The five methods are all published; the spread between them is the point.
Same company, same quarter, four different answers. Between the three that are all genuinely the magic number — net new ARR, subscription revenue and total revenue — the spread is 1.20×. Widen it to the two near neighbours people quote under the same name and it reaches 1.76×. Under the interpretation tables in the next section, 1.60 reads as very efficient, and under one of them as over-efficient. 0.91 reads as merely acceptable.
Three of those gaps are worth naming. Gross new ARR ignores churn, so it flatters any company losing revenue. Total GAAP revenue drags in services income, which is real money but not recurring and not what a sales dollar was supposed to buy; the definitional boundary is the same one that makes annual recurring revenue contested in the first place. And the margin-adjusted version is a different metric entirely, discussed further down.
None of this is exotic. It means a magic number quoted without its method is not a number.
Scale Venture Partners set the healthy baseline at 0.7, not 1.0
The origin is contested, and the two accounts point at the same company. Dale Chang’s history at Scale Venture Partners records that Rory O’Driscoll coined the term in 2005 while looking at Omniture, on seeing that it was able to generate “more than $2 in first-year revenue for every $1 invested in their go-to-market engine,” and saying: “It’s Magic!”
What the same firm publishes about ordinary companies is the part that gets dropped in transmission.
| Source | What it says | Population |
|---|---|---|
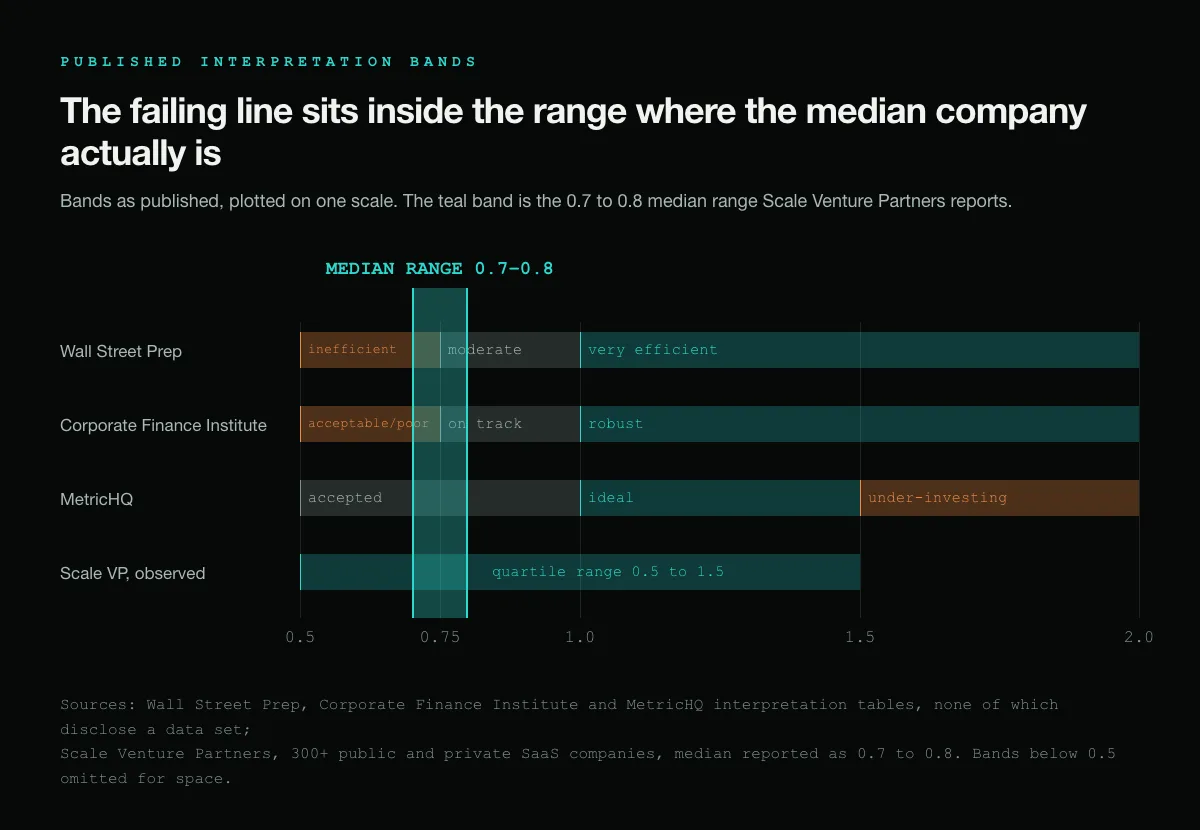
| O’Driscoll, Scale VP, 2010 | Above 1.0x compelling; 0.5x–1.0x reaches breakeven “only in a relatively capital in-efficient way”; below 0.5x “still has not figured out it’s model” | — |
| O’Driscoll, Scale VP, 2019 | “The median Magic Number for our data set is between .8x and .7x, and the range from top quartile to bottom quartile is between .5x and 1.5x” | “300+ public and private SaaS companies” |
| Chang, Scale VP, 2020 | “a Magic Number of 0.7x is a fairly healthy efficiency baseline for most SaaS businesses”; long-term median “has hovered around 0.7x” and “most recently has been trending down” | Scale Studio private + Scale SaaS Index public |
| ICONIQ Growth, 2023 | Top performers hold 1.3x+ to roughly $50m ARR; scaled companies stabilise at 1.0x–1.2x | 96 B2B SaaS companies, 13 of them public |
| Wall Street Prep | Below 0.75 inefficient; 0.75–1.0 moderately efficient; above 1.0 very efficient | interpretation table, no data set |
| Corporate Finance Institute | Below 0.50 stop spending; 0.50–0.75 sits “in between what is usually considered acceptable and what is a poor number”; above 0.75 on track; above 1.0 robust | interpretation table, no data set |
| MetricHQ | 0.5–1.0 accepted by most investors; 1.0–1.5 ideal; above 1.5 “may show that the company is under-investing in Sales & Marketing” | interpretation table, no data set |
Read the table in one direction and something awkward falls out. The only sources that disclose a sample put the industry median at 0.7 to 0.8. Two of the three widely copied interpretation tables place 0.7 in their failing band. The modal published verdict on the median SaaS company is that it is failing.
Scale Venture Partners is on both sides of this. Its 2010 bands put 0.5x to 1.0x in the capital-inefficient bucket; its 2019 and 2020 writing reports that bucket as where the median company actually sits. The firm never reconciles the two, and the reading above is ours, not a published finding. There is an innocent explanation for it: the tables were written for companies raising venture money, where the bar is deliberately set above the median. It still means a board that treats 1.0 as the pass mark is holding the company to roughly the top third of an industry, and should say so out loud rather than presenting it as the standard.
One more distinction the tables flatten: the number is motion-dependent. ICONIQ’s 2023 data puts top-quartile self-serve companies at 2.0x–4.0x while enterprise-sales companies stabilise around 1.0x–1.2x. Comparing the two without saying which is which is comparing sales models, not efficiency.
The one-quarter lag is an assumption, and large deals outrun it
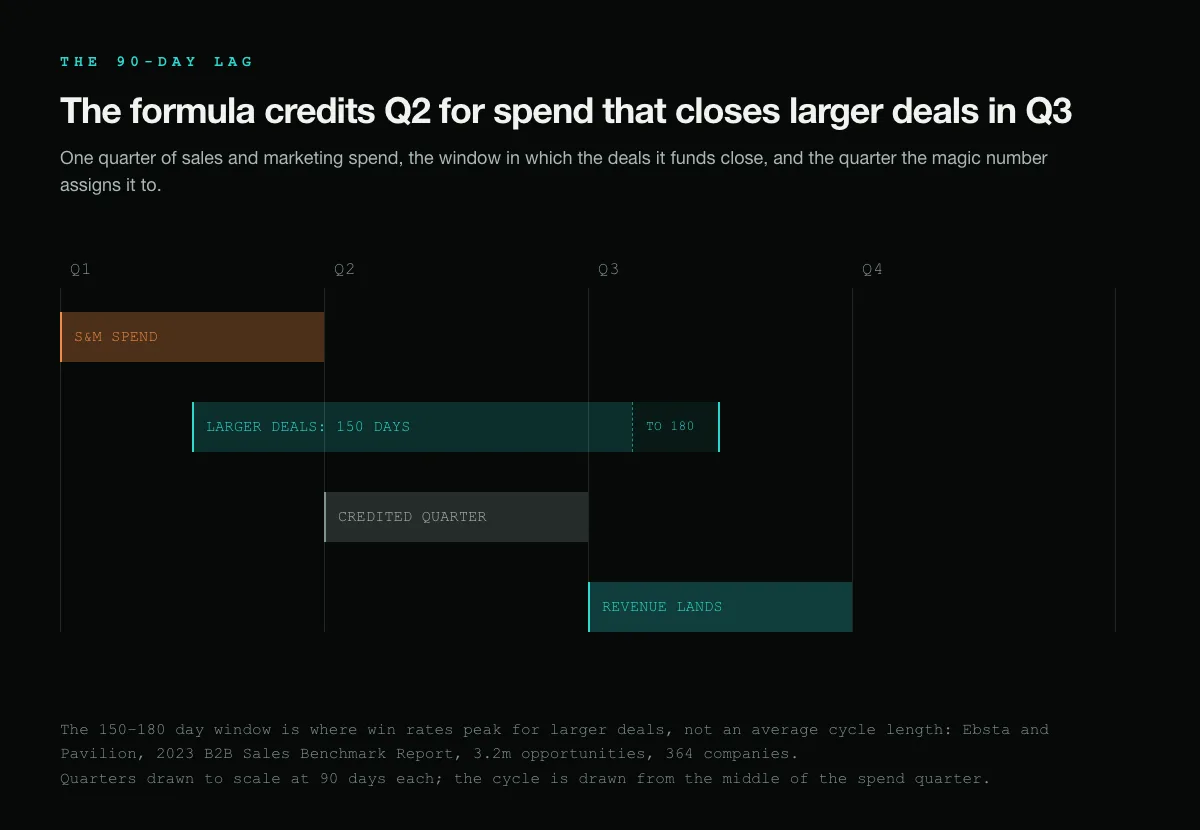
Every published version of the formula puts last quarter’s spend under this quarter’s revenue. Corporate Finance Institute gives the reason in a clause: “there is usually a lag between the expense and when the revenue is generated.” ICONIQ is more explicit, describing its version as accounting “for the lag of a typical sales cycle.”
One quarter is 90 days. Ebsta and Pavilion’s 2023 B2B benchmark report, built from 3.2 million opportunities across 364 companies, puts the window in which win rates peak for larger deals at 150 to 180 days. Nnamdi Iregbulem, analysing 230 quarterly data points across 26 software companies, works from an assumption of three-to-six-month sales cycles. On Ebsta’s figures, and at the upper end of Iregbulem’s range, a 90-day lag falls short of large-deal motion by roughly one quarter. At the bottom of Iregbulem’s range it is exactly right, which is the point: one quarter is a single convention applied to sales cycles that differ by a factor of two.
The lag also does something the sources do not mention: it is not neutral, and its size is exactly the growth rate of your own spending. Dividing by the prior quarter rather than the current one multiplies the result by whatever sales and marketing grew by between them.
| Quarter-on-quarter change in S&M | Lagged number, against the same-quarter version |
|---|---|
| +30% | 1.30× as high — 30% higher |
| +10% | 1.10× as high — 10% higher |
| Flat | identical |
Our arithmetic. The ratio of the two versions is simply current-quarter S&M over prior-quarter S&M.
A company scaling spend 30% a quarter reports a magic number 30% above what the same revenue would produce against the same quarter’s spend, and none of that lift came from selling better. The convention is defensible — the deals genuinely were bought with older money — but it is a convention, and it rewards acceleration mechanically. Iregbulem’s causal estimate points the same way from the other side: he finds a $1m increase in sales and marketing produces about $380k of new ARR in that quarter — $0.38 per dollar spent — and estimates the true causal magic number at roughly 0.6 after four quarters, against an observed 2.1 in his sample.
Cutting sales and marketing spend makes the number go up
Because the denominator is a past quarter’s spend and the numerator is this quarter’s revenue, the two respond to a budget cut at different times. Iregbulem states the pattern plainly: magic number “tends to decline when S&M grows rapidly and tends to increase when S&M spend is suddenly cut.”
Take the company above, and suppose that instead of lifting Q2 spend to $2.2m it cuts the budget 40% to $1.2m.
| Quarter of spend | S&M spent | Net new ARR the following quarter | Magic number reported for that quarter |
|---|---|---|---|
| Q1 | $2.0m | $2.4m | 1.20 |
| Q2 | $1.2m | $1.9m | 1.58 |
| Q3 | $1.2m | $1.1m | 0.92 |
Our arithmetic on illustrative figures. The revenue decline is assumed to lag the spend cut, which is the same assumption the formula itself makes.
Q3 is the flattering quarter: growth fell by a fifth and the efficiency metric improved by a third. A management team reporting quarterly, in the quarter after a cut, is reporting its best magic number of the year at the moment the business got weaker. By Q4 the picture inverts, and the number is worse than before the cut was made.
This is the practical case for never reading the metric on one quarter. Four quarters of it, next to the spend that produced each, says something. A single print says almost nothing about efficiency and a great deal about what happened to the budget two quarters ago.
No published table has a band for a negative magic number
Every interpretation table stops at zero. We checked Scale Venture Partners, ICONIQ, Wall Street Prep, Corporate Finance Institute, MetricHQ, Klipfolio, The SaaS CFO and the two most analytical independent treatments of the metric, by Nnamdi Iregbulem and CJ Gustafson, and none of them gives a band, a reading or a rule for a magic number below zero. It is a genuine gap, and not a hypothetical one: Jamin Ball’s Q1 2025 review of 30 public software companies found five of them with ARR lower than the quarter before — a sixth of the sample. He does not compute their magic numbers; that they were negative is our inference from the sign of the numerator, and there is no published way to read them either way.
Return the company to its original path — Q2 spend of $2.2m, no cut — and carry it one quarter further into a bad Q3. Subscription revenue falls from $4.6m to $4.5m.
| Line | Value |
|---|---|
| Gross new ARR won in the quarter | $2.0m |
| Churn and contraction | $2.4m |
| Net new ARR | −$0.4m |
| Magic number (−$0.4m ÷ $2.2m of Q2 spend) | −0.18 |
| Gross new ARR ÷ the same spend | 0.91 |
Our arithmetic on illustrative figures. The $2.4m of churn and contraction is 13% of an opening base of roughly $18.4m of ARR in a single quarter — a severe quarter, which is the situation worth testing the metric against.
Sales and marketing bought $2.0m of new business on $2.2m of spend, a gross figure of 0.91 — above the median the same firms report for the net version. The magic number reads −0.18 because retention, which sales and marketing did not control, subtracted more than the new business added.
That is the period-metric problem in its clearest form. The number does not measure how well go-to-market performed; it measures net revenue movement and attributes all of it to go-to-market. When retention is the dominant term, the metric is reporting on the wrong department. A company in that position should read gross new ARR against spend to see whether acquisition still works, and read retention separately to see what is actually happening — and the magnitude of a negative print carries no information about efficiency at all, only about how much revenue was lost.
Magic number and CAC payback are the same arithmetic twice over
The two metrics that dominate SaaS efficiency discussion are reciprocals. O’Driscoll says so in one line: “Payback (on a revenue not a gross margin basis) is simply the inverse of this number, which implies that the average SaaS company is earning back in revenue what it spends in sales and marketing in one divided by .7 years — 17 months — with a top/bottom quartile range of eight months to two years.”
So payback months on a revenue basis = 12 ÷ magic number.
| Magic number | Revenue-basis payback | At 76% gross margin |
|---|---|---|
| 1.20 | 10.0 months | 13.2 months |
| 1.00 | 12.0 months | 15.8 months |
| 0.70 | 17.1 months | 22.6 months |
| 0.50 | 24.0 months | 31.6 months |
Our arithmetic. The margin-adjusted column is 12 ÷ (magic number × gross margin).
Two consequences follow. The first is that arguing about magic number thresholds and arguing about payback thresholds are the same argument in different units, so a company holding both as separate targets should check they are consistent; what counts as an acceptable payback is a question in its own right, and our guide to CAC payback period works through it.
The second is that the identity only holds on a revenue basis. Payback as it is used in practice is gross-margin adjusted, which is why the third column exists. The gap between columns two and three is not a rounding difference. At a 0.7 magic number it is 5.4 months.
Sales efficiency ratio: same shape, different numerator, different quarter
The two terms overlap enough to be treated as synonyms and differ enough for that to cost money. Software Equity Group defines the general case as revenue “generated per dollar of sales and marketing expenses during a given period,” then splits it: divide “your gross new ARR for the period by your sales and marketing expenses from the same timeframe,” or divide “your net new ARR by your sales and marketing expenses of the same period.”
Read the denominator and a second difference appears, one the published comparisons skip. Software Equity Group’s spend is the same quarter. The magic number’s is the quarter before. Two things move between the definitions, not one.
| Name | Numerator | Denominator | On the example above |
|---|---|---|---|
| Gross sales efficiency, Software Equity Group | Gross new ARR | Same-quarter S&M | 1.45 |
| Net sales efficiency, Software Equity Group | Net new ARR | Same-quarter S&M | 1.09 |
| Gross sales efficiency, Wall Street Prep | Gross new ARR | Prior-quarter S&M | 1.60 |
| Net magic number | Net new ARR | Prior-quarter S&M | 1.20 |
| Magic number, revenue form | Revenue delta × 4 | Prior-quarter S&M | 1.20 |
Same-quarter figures divide by Q2 spend of $2.2m, prior-quarter figures by Q1 spend of $2.0m. Our arithmetic on the same illustrative quarter.
Net sales efficiency and the net magic number are the same calculation only when sales and marketing spend is flat between the two quarters. Where it is not, they differ by exactly the ratio set out in the lag section above: this company grew spend 10%, so its magic number is 10% above its net sales efficiency, and nothing about its selling changed. Gross sales efficiency then differs for a second reason on top of the first, because it ignores churn and contraction — the gap between gross and net is the revenue being replaced rather than added.
The practical rule: an unqualified “sales efficiency ratio” is ambiguous on two axes at once, and the ambiguity resolves in the flattering direction when someone is presenting. Ask which numerator and which quarter’s spend, then compare like with like.
SaaS gross margin sits outside the formula entirely
The magic number counts revenue, not gross profit. Corporate Finance Institute treats that as a feature: ignoring gross margin, it writes, means the metric “becomes more comparable across different SaaS companies.” It is defensible, and it also means the number says nothing about whether the revenue it counts is worth having.
The margin-adjusted shape is older than the omission. Bessemer’s original CAC ratio, as recorded by Dave Kellogg in 2013, was “the annualized amount of incremental gross margin in 3Q08 divided by total S&M expense in 2Q08” — the same structure with gross profit in the numerator instead of revenue.
Apply it to the same 0.7 baseline:
| Gross margin | Gross profit bought per $1 of S&M, at a 0.7 magic number |
|---|---|
| 85% | $0.60 |
| 76% | $0.53 |
| 60% | $0.42 |
| 50% | $0.35 |
Our arithmetic: magic number × gross margin.
Of two companies both reporting 0.7, the one at an 85% margin keeps 70% more gross profit per sales and marketing dollar than the one at 50%. This has stopped being a hypothetical. Kyle Poyar’s 2025 benchmarks report, based on more than 800 companies surveyed in August and September 2025, records gross margins “down nearly 10 pts year-on-year for early-stage companies, likely driven by AI costs.” Andreessen Horowitz’s earlier account of AI-heavy businesses put their gross margins “often in the 50-60% range – well below the 60-80%+ benchmark for comparable SaaS businesses,” though the firm describes that as anecdotal rather than survey data.
The implication is narrow and worth stating anyway: a company whose cost of revenue is rising because of model inference can hold its magic number flat year over year while the economics behind it deteriorate. The metric will not show it. The margin-adjusted version will.
Where the number is worth acting on
The magic number does one job well: it puts a price on growth in a single figure that a board can hold across quarters. It does that job badly on any single quarter, on any company whose retention is moving faster than its new business, and on any comparison between two companies that did not state their method.
Four questions make a quoted magic number usable. What is in the numerator — gross new ARR, net new ARR, or a revenue delta including services? Which quarter’s spend is underneath it? What did sales and marketing spend do between those two quarters, since that alone can move the answer 30%? And what is the gross margin, since the metric ignores it entirely?
Answering those four turns the figure into evidence. Skipping them turns it into a talking point — which, with a median of 0.7 to 0.8 and interpretation tables that start failing at 0.75, is how a perfectly ordinary company ends up defending itself against a benchmark it never agreed to. If the underlying question is where the go-to-market money should go rather than how to score it after the fact, that is the work we do for B2B SaaS companies.
10 / Reader questions
Frequently asked questions
01How do you calculate the SaaS magic number?
Take the change in subscription revenue between two quarters, multiply it by four to annualise it, and divide by the earlier quarter's sales and marketing expense. That is the original 2010 formulation from Scale Venture Partners. Companies that track ARR use the equivalent shorter form, net new ARR for the quarter over the previous quarter's spend, with no multiplier because ARR is already annual.
02What is a good SaaS magic number?
Around 0.7 to 0.8 is ordinary and above 1.0 is genuinely strong. Scale Venture Partners, whose partner coined the metric, calls 0.7 a fairly healthy baseline and reports a median between 0.7 and 0.8 across a data set of more than 300 public and private SaaS companies, with a top-to-bottom quartile range of 0.5 to 1.5. Interpretation tables that start their failing band at 0.75 are therefore holding companies to better than the median.
03What does a negative SaaS magic number mean?
It means recurring revenue fell over the quarter, so the numerator went below zero. No published source gives a band for reading it, and the figure is not a sales efficiency signal at all: it measures net revenue movement, so a quarter with strong new business but heavier churn still prints a negative number. Read gross new ARR against spend instead.
04What is the difference between the magic number and the sales efficiency ratio?
They differ on two axes. Gross sales efficiency puts gross new ARR in the numerator and ignores churn and contraction, which makes it larger than the magic number for any company losing revenue. And Software Equity Group defines sales efficiency against the same period's spend, where the magic number uses the previous quarter's — so the two coincide only when sales and marketing spend is flat.
05Is the SaaS magic number the same as CAC payback period?
They are reciprocals of each other on a revenue basis. Rory O'Driscoll of Scale Venture Partners states it directly: payback on a revenue rather than gross margin basis is simply the inverse of the magic number. A magic number of 0.7 implies roughly 17 months of revenue-basis payback. The gross-margin-adjusted payback used in practice is longer.
06Should the magic number use ARR or GAAP revenue?
Use net new ARR if you have it; GAAP revenue is the substitution for companies that do not report ARR. The two agree when subscription revenue is the only revenue. They diverge as soon as professional services, hardware or usage overages sit inside the reported revenue line, because those move the numerator without changing the recurring base.
07What is the 3 3 2 2 2 rule of SaaS?
It is a growth-rate ladder, not an efficiency metric: triple annual recurring revenue two years running, then double it three years running — roughly $2m of ARR to about $144m over five years. Neeraj Agrawal of Battery Ventures published it in 2015 as T2D3. It describes how fast to grow, while the magic number describes what that growth costs.