Published
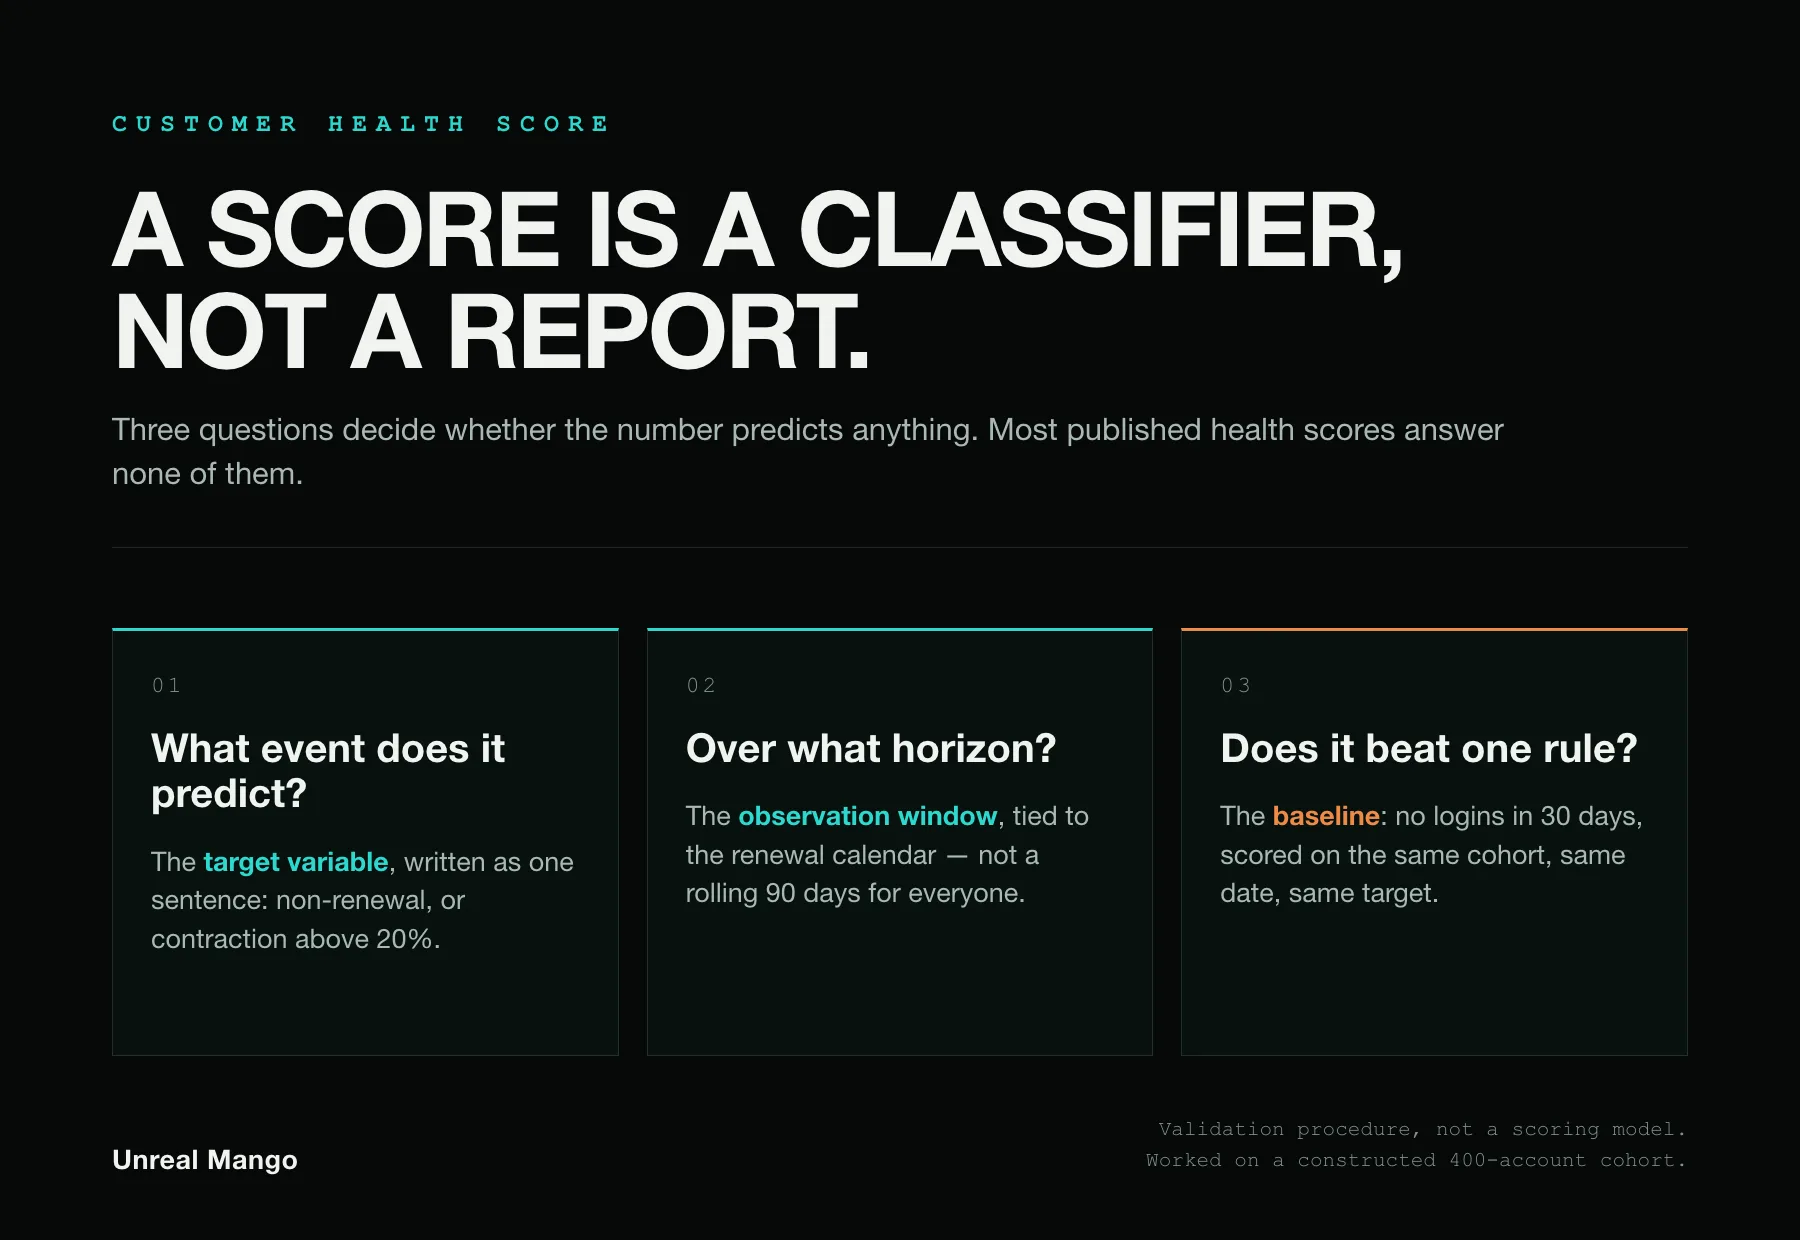
A customer health score is a classifier: it sorts accounts into risk groups and predicts one named outcome — usually non-renewal, or contraction beyond a stated size — over a stated horizon. Without a target variable, a horizon and a back-test against a one-signal baseline, it is a dashboard colour, not a prediction.
How this was checked. Every guide on the first page of results for this term lists inputs, and most of them a colour band; none states over what window the score predicts, or how it performed against history, and none compares its weighted sum with a simpler rule. This article fills that gap with a procedure rather than a model. The arithmetic runs on one constructed cohort of 400 accounts, worked in full so you can substitute your own figures — it is an illustration, not client data. Statistical claims are attributed to the published sources named where they appear.
What a customer health score has to predict, and by when
A score is a prediction only if you can write down the sentence it predicts. Two blanks have to be filled: the target variable, which is the event, and the horizon, which is the window in which that event either happens or does not.
“This account is unhealthy” fills neither. “This account will not renew at its next renewal date” fills both, and can be checked against what happened. So can “this account will cut its contract value by more than 20% within 180 days”. The difference is not pedantry — it decides whether anyone can ever tell you the score was wrong.
| Target variable | Who acts on it | What makes it hard |
|---|---|---|
| Non-renewal at the next renewal date | Renewals desk, CSM | The event is rare, so the model sees few examples |
| Contraction above 20% of contract value | Account management | More frequent, so more data; the cut point is arbitrary |
| Either event within 180 days of today | CSM capacity planning | Mixes two outcomes and needs a rule for accounts with no renewal in the window |
Pick one, write it in a sentence, and print that sentence on the same screen as the score. A number labelled only “health” will be read as whatever the reader already believes, and three teams will act on three different meanings of the same 62.
A health score is also not a retention metric. It is a forecast about individual accounts; net revenue retention is the realised outcome across all of them, measured after the fact. If the classifier works, the red band should turn up in that number one or two quarters later, which is the only external check the score ever gets.
The renewal date sets the horizon, and censoring decides who counts
For most B2B contracts churn is not a continuous risk. An account on an annual contract can only leave on one day a year, and the decision is usually made in the weeks before it. That fixes the horizon for you: the useful window is the run-up to the renewal date, not a rolling ninety days applied uniformly to a base where half the contracts renew in March.
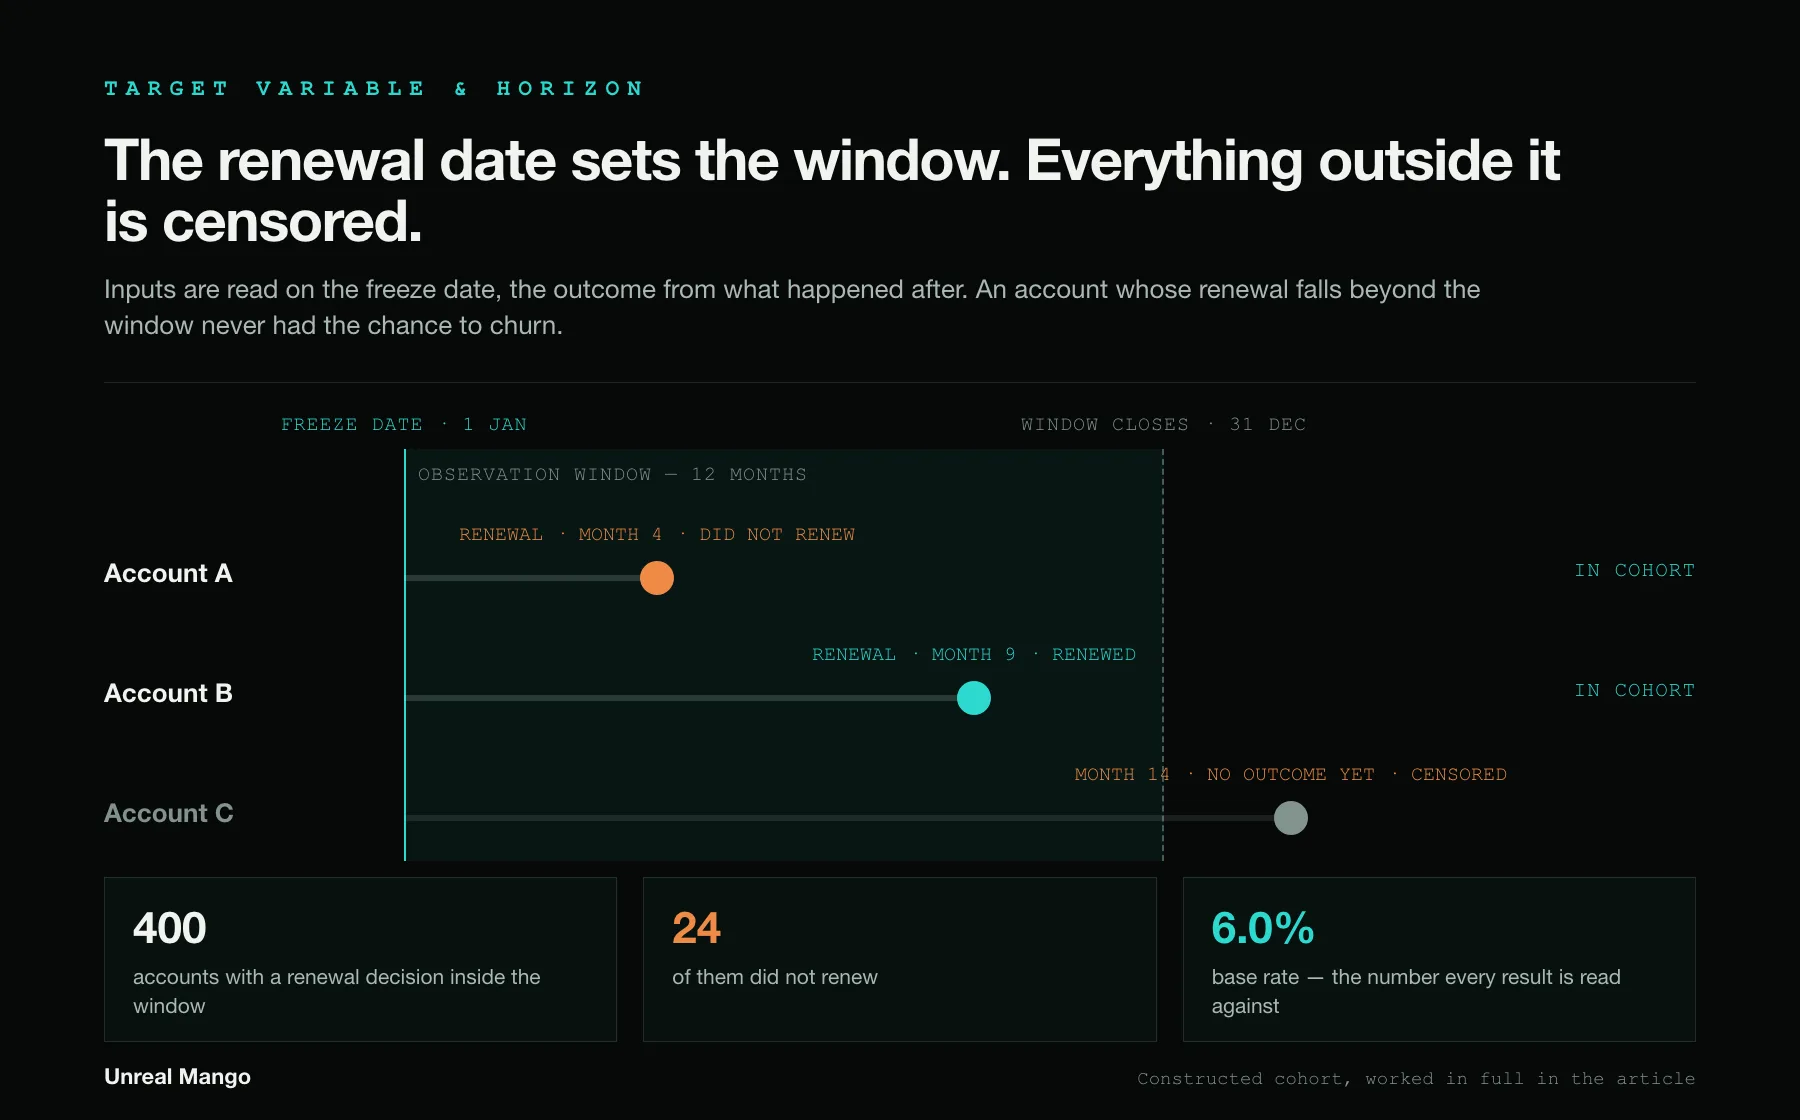
It also creates the defect that quietly ruins most back-tests. If you evaluate a score over the twelve months after a frozen date, accounts whose renewal falls after that window never had the chance to churn. They are right-censored — the outcome has not happened yet, not the same thing as a good outcome. Counting them as retained inflates the negative class and makes any model look better than it is, because the easiest accounts to predict correctly are the ones that could not have failed.
The fix is a cohort rule, applied before any scoring: keep only accounts whose renewal decision falls entirely inside the observation window, and drop the rest. In the worked example below the freeze date is 1 January, the window is the following twelve months, and the 400 accounts are exactly those with a renewal date inside it. Twenty-four of them did not renew — a base rate of 6.0%, which is the number every figure that follows has to be compared against.
Logins in the last 30 days: the baseline your model has to beat
Every classifier needs a control, and for account risk the control writes itself: no user on the account has logged in for 30 days. It costs nothing to compute, it is explainable to a CSM in one sentence, and it does not shift when somebody edits a weight in a spreadsheet.
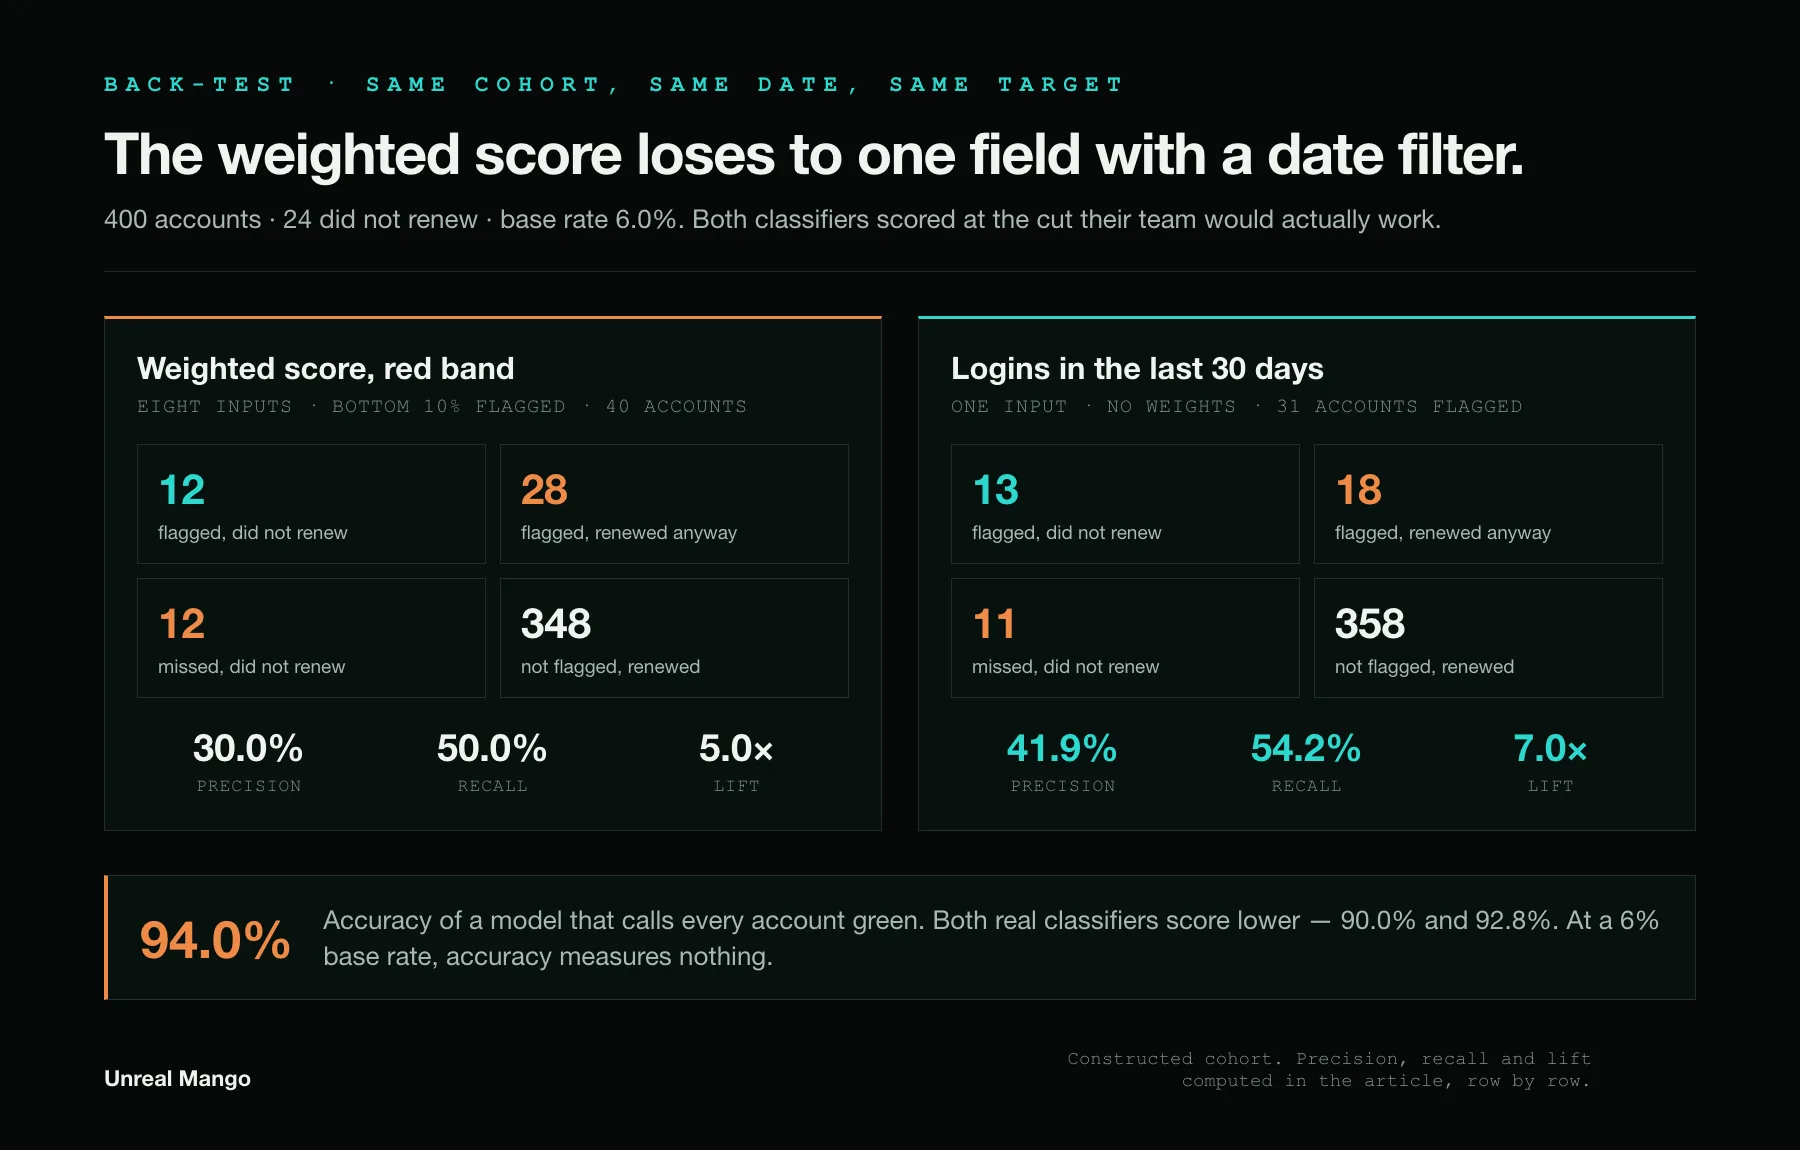
Run it on the same cohort, on the same freeze date, against the same target. On our 400 accounts it flags 31, and 13 of those 31 did not renew. The proposed weighted score — eight inputs, weights agreed in a workshop, red band set at the bottom 10% — flags 40, and 12 of those did not renew.
That is the whole test, and the weighted score loses it. If your model cannot beat one field with a date filter on it, ship the field and spend the saved effort on the data instead.
Back-testing on historical cohorts: freeze the date, then look forward
The procedure is six steps, and only the second one is difficult.
- Pick a freeze date far enough back that the full horizon has already elapsed.
- Reconstruct every input as it stood on that date, not as it stands today.
- Label the outcome from what those accounts did afterwards.
- Score every account with the model you are proposing.
- Score the same accounts with the one-signal baseline.
- Compare both at the threshold you will actually use.
Step two is where most in-house back-tests break, because customer systems overwrite rather than append. Health scores get recomputed nightly and the old value is gone; the CRM stage field says “Churned”; the ticket log contains the conversation from the cancellation call. Any of those fields will make the model look extraordinary and predict nothing, because they were written after the outcome they are being used to forecast. If you cannot reconstruct a field as of the freeze date, drop it from the model rather than approximating it.
With both classifiers scored on the same 400 accounts, the comparison is a single table.
| Weighted score, red band | Logins-in-30-days rule | |
|---|---|---|
| Accounts flagged | 40 | 31 |
| Non-renewals caught, of 24 | 12 | 13 |
| Precision | 30.0% | 41.9% |
| Recall | 50.0% | 54.2% |
| Lift over the 6.0% base rate | 5.0× | 7.0× |
| Overall accuracy | 90.0% | 92.8% |
The last row is the one worth pausing on. A model that marks every account green — that is, a model with no inputs at all — is right on 376 of 400 accounts, which is 94.0% accuracy, higher than either real classifier. Accuracy is not a measure of anything when one class is 6% of the population. Saito and Rehmsmeier make the neighbouring point formally: on imbalanced data the precision-recall view is more informative than the ROC plot, because a large negative class makes specificity look reassuring while the false positives you are paying for pile up.
Precision at a 6% base rate: what a red list of forty accounts contains
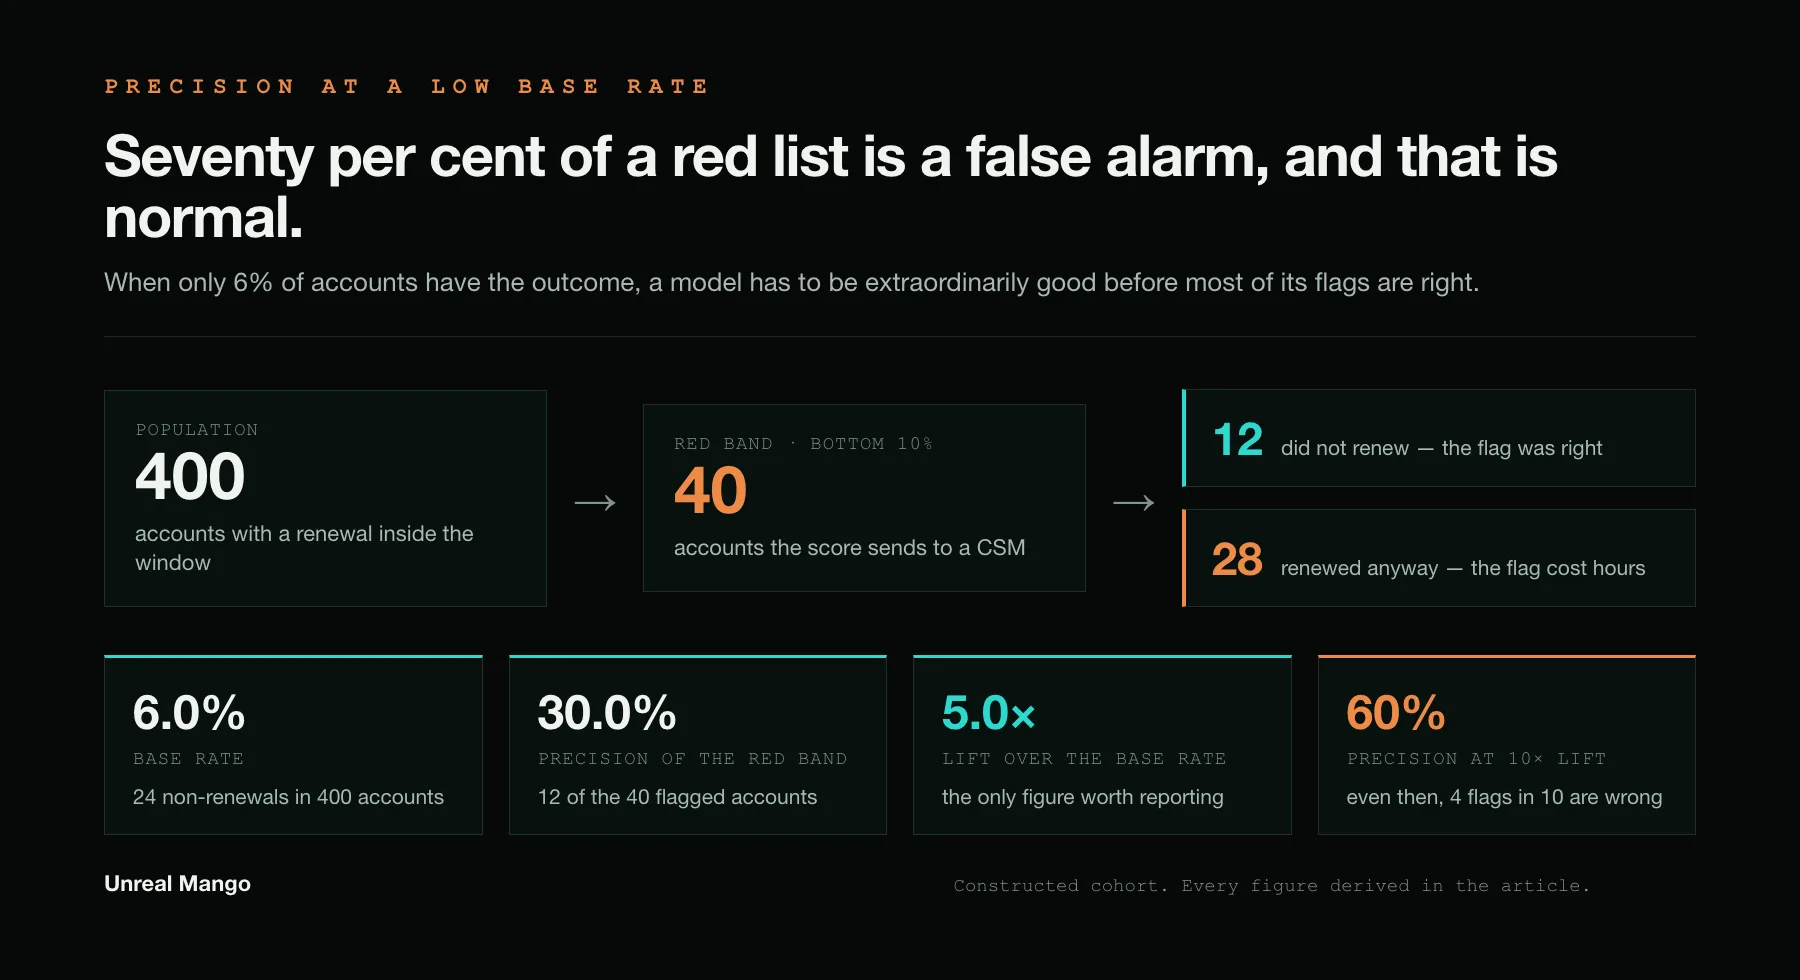
Twenty-eight of the forty accounts in that red band renewed normally. Seventy per cent of the list was a false alarm, and that is not a broken model — it is arithmetic that no amount of feature engineering removes.
The reason is the base rate. When only 6% of the population has the outcome, a classifier has to be extraordinarily good before most of its flags are correct. Our red band runs at 30% precision, five times the base rate; a much stronger model at ten times the base rate would still be wrong on four of every ten accounts it flagged. Precision at any realistic level of discrimination is held down by how rare the event is, and low prevalence is the normal condition for renewals in a business with reasonable retention.
Two things follow, and neither of them is a modelling decision.
Size the red band to the capacity that will work it, not to a score value. Forty accounts is a workload before it is a prediction, and the two numbers have to be compared over the same twelve months the band was scored on. A rescue engagement is not a phone call: if each of two CSMs can carry two of them at a time and each one runs about a quarter, the base absorbs sixteen a year, not forty. The honest band is then the sixteen lowest-scoring accounts, and the threshold is whatever score value produces that count. Setting the cut first and discovering the workload afterwards is how red lists become wallpaper.
Price the false positives explicitly. The twenty-eight unnecessary check-ins in the band as it was scored cost real hours, and they also cost credibility: a CSM who is sent to rescue three healthy accounts in a row stops believing the fourth flag. The tolerable false-positive rate is a capacity decision made by whoever owns that team, and it belongs in the same document as the target variable.
Green, yellow and red are a cut on a ranking, not a property of the account
There is no health score value that is good in general, which is why no page answers the question. Sixty-two means nothing outside the distribution it came from: the same account scores differently under two weightings, and the same weighting scores differently after a product release changes what an event means.
What a band can carry is a measured statement. “Accounts in our red band did not renew at 30% over the last four quarters, against a base rate of 6%” is a fact about your business that survives being repeated to a board. “Below 60 is red” is a formatting rule.
Two practical consequences. Define bands by rank, not by score value — the bottom 10% of accounts by score, rather than everything under 60 — because score distributions drift upward as products add instrumented events, and a fixed cut silently empties itself. And accept that moving the cut trades recall for precision in one direction only: widen the red band and you catch more churners while diluting the list; narrow it and the list gets truer and smaller. There is no setting that improves both, and choosing between them is a business decision, not a data one.
Signal, what it actually measures, and what breaks it
Nine inputs turn up across the published health scoring guides; no single guide uses all nine, and most work from a subset. Each one measures something narrower than its label suggests, and each one has a specific failure mode worth knowing before it carries points.
| Signal | What it actually measures | What breaks it |
|---|---|---|
| Logins in the last 30 days | Whether anyone opened the product at all | Single sign-on keeps sessions alive; one power user carries a dormant team |
| Weekly active users against licences assigned | Breadth of adoption | Licences bought in a block and never provisioned depress it permanently |
| Use of the feature the contract was bought for | Whether the job is being done | The feature gets renamed or moved and the event stops firing |
| Support tickets opened | Contact volume, not satisfaction | Heavy, healthy users file more tickets than disengaged ones |
| Ticket resolution time | Your own team’s speed | Queue policy changes and holidays move it without any customer changing |
| Survey sentiment | The opinion of whoever answered | Response rates below 20%, and the respondent is rarely the signer |
| Executive sponsor still in role | Continuity of the buying decision | CRM contact records go stale faster than people change jobs |
| Invoices paid on time | A finance process | Net-60 terms and procurement portals make healthy accounts look late |
| Contract value or seat count | Commercial size | Confuses “important to us” with “unlikely to leave” |
Two rows deserve a note. Survey sentiment is the input teams trust most and instrument worst — a score sitting on a 12% response rate is a score sitting on the opinions of the twelve per cent, and the benchmark question of what a good result even looks like has its own long answer in what is a good NPS score. And contract value is not a health signal at all: it belongs in the prioritisation of who you call first, on a separate axis, not inside the number that estimates risk.
Three inputs, one signal: why summing correlated fields counts it twice
Look again at the first three rows. Logins, active users against licences, and use of the core feature are three views of one underlying fact: is this account using the product. An account that has gone quiet scores at the floor on all three simultaneously — not because it failed three tests, but because it failed one, three times.
Give those three inputs 20, 15 and 15 points of a 100-point score and usage now carries half the total, whatever the workshop believed it was allocating. Add support tickets, which fall when usage falls, and the real weight is higher still. This is the mechanism behind health scores that look balanced on the slide and behave like a single-signal rule in production — which, incidentally, is why the one-signal baseline is so hard to beat.
The check is cheaper than a correlation matrix. Remove one input, re-run the back-test, and look at whether lift moves. If dropping weekly active users changes nothing, the score was never using it as independent evidence; keep it on the account screen as context and take it out of the arithmetic.
Equal weights are the defensible default, and picking the signals is the real work
Almost every guide arrives at the same instruction: assign weights based on what matters to your business. That is an invitation to invent numbers, and the research on linear models suggests it matters far less than the ceremony implies. Robyn Dawes, reviewing two decades of work on “improper” linear models, reported two separate results that are easy to run together and should not be. Equal-weight models beat cross-validated regression weights in three of the four examples where he reports both (.60 against .57 twice, .48 against .38), and lost the fourth (.34 against .46); his fifth example reports no cross-validated regression figure at all. Models with randomly chosen weights of the correct sign beat the expert judgments they were built to reproduce in every example, and stayed below cross-validated regression in three of those four, edging past it in the one where the regression itself did worst (.39 against .38). Both results point the same way for the decision in front of you: what carried the performance was choosing the right variables and knowing the direction of each, not the precision of the coefficients.
The practical reading is to start at equal weights and make each signal earn a departure from them through the back-test, one input at a time. The mechanics of fitting weights against your own historical outcomes, and of making a score decay, are worked through in detail for the sales side of the same problem in our guide to lead scoring; the arithmetic transfers, the base rate does not.
Churn events, not accounts, decide whether you have enough data
The constraint on how elaborate a score can be is not the size of the customer base. It is the number of times the event you are predicting has actually happened.
Our 400 accounts produced 24 non-renewals in a year. Fit eight weighted inputs to that and you are at three events per input. The long-standing rule of thumb in the statistical literature, from Peduzzi and colleagues’ 1996 simulation study of logistic regression, is that fewer than ten events per variable produces coefficients biased in both directions and an increase in what they called paradoxical associations — signals coming out significant with the wrong sign. At ten events per variable, this base supports two inputs, not eight.
That rule has been argued with since, and the argument cuts both ways. Van Smeden and co-authors concluded in 2016 that the evidence supporting the one-variable-per-ten-events criterion is weak, that what goes wrong at a low events-per-variable ratio depends on total sample size as much as on the ratio itself, and that Firth’s correction improves the coefficients when events are scarce. That is not permission to fit a third input to twenty-four events; it is also not a defence of the number ten. Carry it as an order of magnitude, not as a criterion.
Run the same arithmetic on a smaller base and the conclusion is blunt. Two hundred accounts at the same 6% rate produce about twelve non-renewals a year: enough to validate one explicit rule, not enough to fit a model. Below that, a health score assembled from eight fields is a description of the eight fields, and it should be labelled as one.
A score that looks convincing and predicts nothing
Here is the failure it is easiest to ship. A team builds a 100-point score from three inputs: tickets resolved within SLA worth 40 points, survey sentiment worth 30, and contract value worth 30. It looks defensible in a review, it correlates with everybody’s intuition about which accounts are good, and it produces a tidy distribution.
Back-tested on the cohort above, its red band of 40 accounts contains three non-renewals. That is 7.5% against a base rate of 6.0% — a lift of 1.25×, resting entirely on three churn events, which is to say no measurable difference at all.
Read the inputs and the result is not surprising. Tickets resolved within SLA measures how fast your own support team worked, which is a fact about you rather than about the customer. Survey sentiment measures the opinion of whoever replied, months ago. Contract value measures size. Nothing in the score is a forward-looking observation of the customer’s behaviour, so nothing in it can forecast the customer’s decision. The score was never wrong; it was never a prediction, and only the back-test could have told anyone that.
When to rebuild the score, and the signal that says it has drifted
Two properties are being tracked, and confusing them is why scores get retuned for the wrong reason. Discrimination is whether the score ranks risky accounts above safe ones. Calibration is whether the numbers mean what they claim — whether accounts in a band churn at the rate the band asserts.
Calibration is the one that decays quietly. Van Calster and colleagues, writing on clinical risk models in 2019, call it the Achilles heel of predictive analytics and note that risk estimates can be unreliable even when a model discriminates well, so that a model with a lower AUC can be more useful than a rival with a higher one if it is better calibrated — their worked comparison prefers QRISK2–2011, at an AUC of 0.771, to NICE Framingham at 0.776, because the second overestimated risk and selected 206 men per 1,000 for treatment where the first selected 110. The same asymmetry applies here: a health score can keep sorting accounts in roughly the right order while the churn rate attached to “red” drifts from 30% to 12%, at which point every capacity decision built on that band is wrong.
So track one number per band per quarter — the realised non-renewal rate of the accounts that sat in it — and treat divergence from the rate at build time as the rebuild trigger. Rebuild on events too: a renamed or merged feature, a new single sign-on flow that changes what a login means, a pricing change that alters who buys seats. What not to do is re-weight on a calendar. On a base producing two dozen events a year, a quarterly re-fit is fitting last quarter’s noise, and it destroys the one comparison that makes the score trustworthy — this quarter’s band against the same band a year ago.
A seven-point validation checklist for a customer health score
Seven checks separate a classifier from a colour scheme. None of them requires a data scientist, and a score that fails any of them is not ready to route anybody’s week.
- The target variable is written as one sentence naming the event, and that sentence is visible next to the score.
- The horizon is written down explicitly — as a window tied to the renewal calendar, or in days where there is no renewal date — and applied the same way to every account in the cohort.
- The evaluation cohort is frozen at a past date, with censored accounts — those whose renewal falls outside the window — excluded rather than counted as retained.
- The base rate is computed first, because every other figure is read against it.
- A one-signal baseline is scored on the same cohort, on the same freeze date, against the same target — each at the cut it will actually be worked at.
- Precision, recall and lift are reported for both, at the cut you will actually work, not at the cut that looks best.
- The realised outcome of each band is recorded every quarter, and divergence from the build-time rate is the trigger to rebuild.
Run those seven and most of the argument about weights disappears, because the back-test answers it. Run none of them and you have built a reporting object: accurate about its own inputs, silent about the future, and expensive in the one currency customer success teams cannot recover, which is attention pointed at the wrong accounts.
Where this sits in a wider measurement stack is worth being precise about. How much of the base leaves in a period is a separate metric with its own arguments about denominators, and what to do with an account once it turns red is a separate playbook with its own evidence; neither is settled by the classifier. What the classifier owes you is a ranked list you can defend, and a number attached to each band that somebody checked. That is the part we build with clients on the tech and SaaS side, and it is almost always the part that was missing.
14 / Reader questions
Frequently asked questions
01What is a customer health score?
A customer health score is a classifier that sorts accounts into risk groups and predicts one named outcome, usually non-renewal or contraction, over a stated horizon. It is not a summary of how an account feels. If the score cannot be checked against what those accounts actually did, it is a report rather than a prediction.
02How do you calculate a customer health score?
Pick the event you are predicting and the window, assemble the inputs as they stood on a past date, then check what those accounts did afterwards. Most published methods stop at a weighted sum of usage, support and sentiment fields scaled to 0 to 100. The calculation is the easy half; the back-test against history is the half that decides whether the number means anything.
03How much health score is good?
There is no score value that is good across companies, because the number is a cut on your own ranking rather than a measurement. The only defensible statement is the realised outcome of each band: accounts in our red band churned at 30% over the last four quarters against a 6% base rate. If you cannot state that sentence, the bands are decoration.
04What is a customer score?
Customer score is the generic label for any single number attached to an account, covering health scores, satisfaction indices and account tiering. The useful distinction is what each one is for: a health score forecasts a future event, a satisfaction score records a past opinion, and a tier records commercial size. Mixing all three into one figure is the most common design error.
05What metrics go into a customer health score?
Product usage, breadth of adoption, use of the feature the contract was bought for, support volume and resolution time, survey sentiment, sponsor continuity and payment behaviour. Each measures something narrower than it appears, and several measure the same underlying fact. Adding correlated fields together counts one signal two or three times and quietly gives it half the score.
06How often should a customer health score be recalculated?
Recalculate the scores nightly, but write each night's inputs and score to an append-only snapshot — otherwise the nightly recompute destroys the history a back-test needs. Rebuild the model only on an event: when the realised churn rate of a band drifts toward the base rate, or when a product change alters what an input means, such as a renamed feature or a new single sign-on flow. On a base producing two dozen churn events a year, quarterly re-weighting fits noise rather than signal.
07Can you build a customer health score with fewer than 200 accounts?
Not as a multi-signal weighted model. Two hundred accounts churning at 6% a year produce about twelve churn events, and it is the events, not the accounts, that limit how many signals you can fit. At that scale a single explicit rule such as no logins in thirty days is the honest model, and it can be validated the same way.