Published
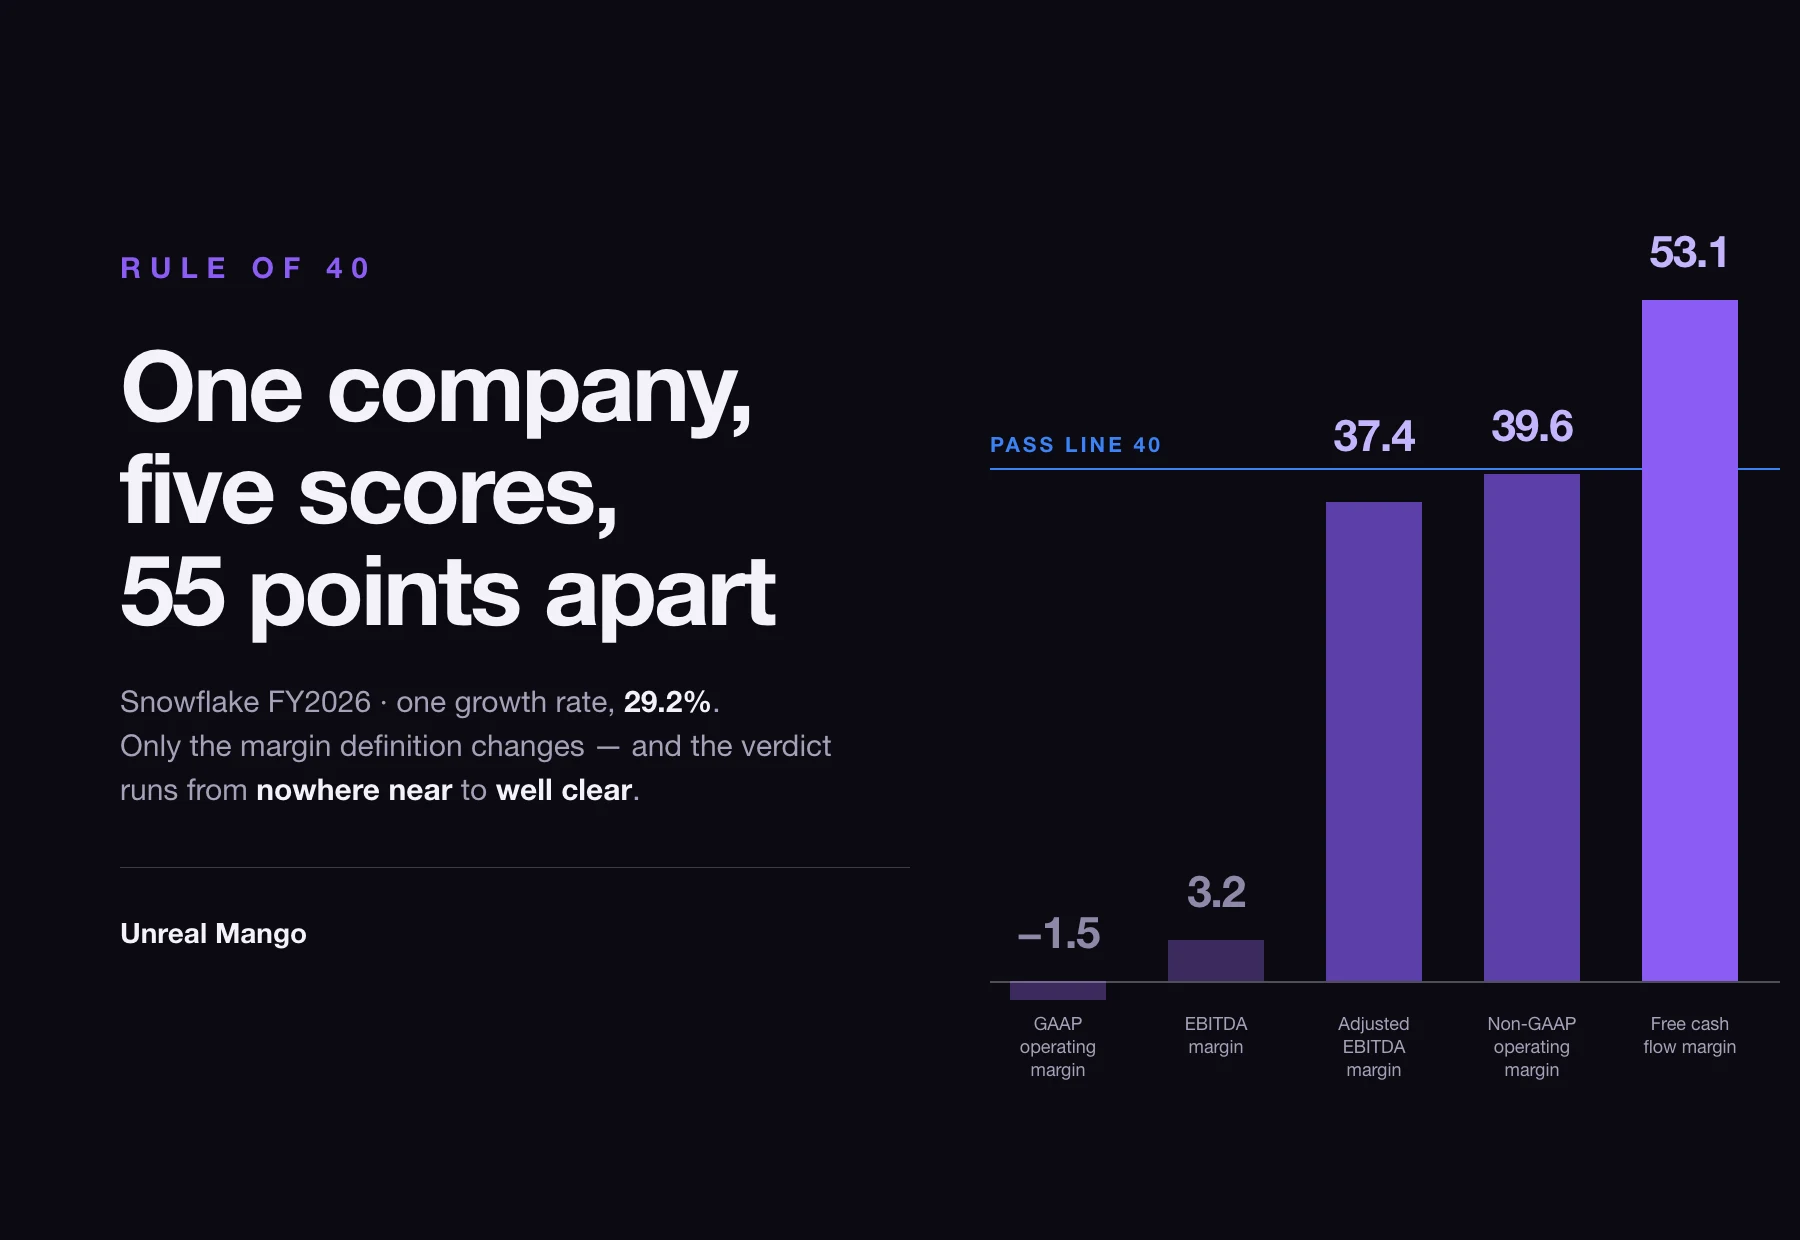
The Rule of 40 says a SaaS company’s annual growth rate plus its profit margin should reach at least 40%. The formula is one line and everyone agrees on it. Neither input has a settled definition, and swapping one published version for another moved a single company’s score by 55 points inside one fiscal year.
How this was checked. In August 2026, ahead of publication, we took the definitions the ranking sources actually use — Brad Feld’s original 2015 post, Wikipedia’s summary, BCG’s May 2025 benchmark study and McKinsey’s 2021 framing — and applied each of them to two public companies’ most recently filed years: Snowflake’s fiscal 2026, ended 31 January 2026, and Palantir’s fiscal 2025, ended 31 December 2025. Every score below is our own arithmetic on figures the companies themselves reported, and each line item is named so the calculation can be redone. Where a figure is our model rather than a filing, the text says so.
Growth plus margin, and five things “margin” can mean
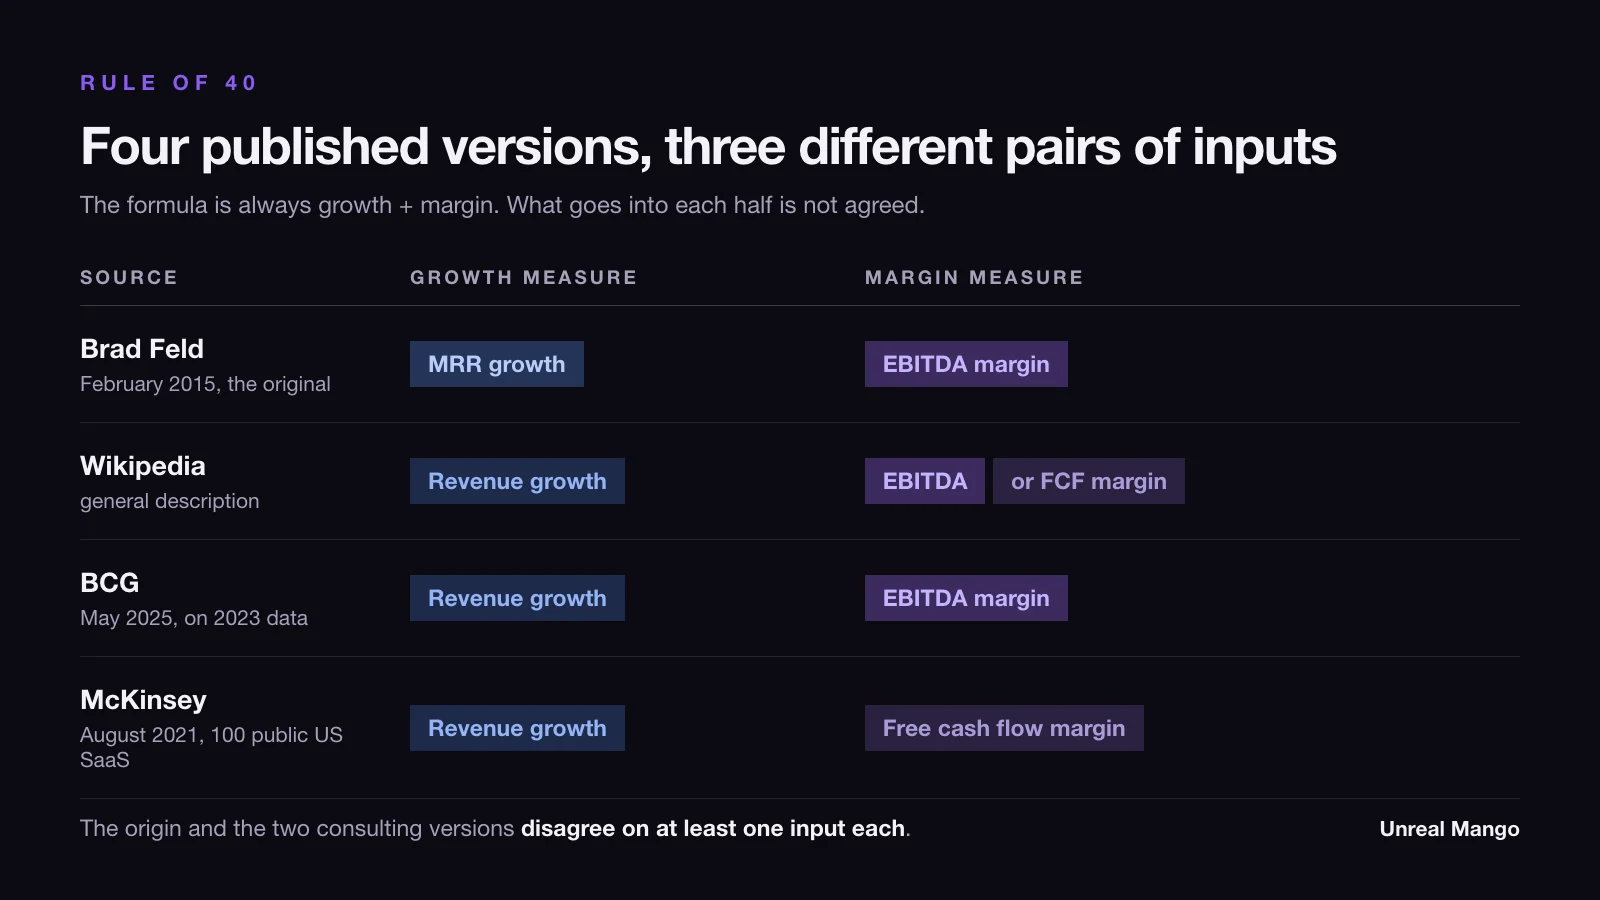
Brad Feld published the rule in February 2015, crediting a late-stage investor he had heard it from at a board meeting. His wording was “your growth rate + your profit should add up to 40%”, with three worked cases: grow 20% and earn 20%, grow 40% and break even, grow 50% and lose 10%.
Two details from that post disappeared on the way into common use. Feld’s growth rate was the year-over-year growth of monthly recurring revenue, not of reported revenue. And his profit line was EBITDA, chosen after he backtested operating income, net income and free cash flow against it.
Everything downstream picked a different pair.
| Source | Growth measure | Margin measure | Population it was fitted to |
|---|---|---|---|
| Feld, February 2015 | YoY growth in monthly recurring revenue | EBITDA margin | SaaS at scale, “assume at least $50 million in revenue” |
| Wikipedia | YoY revenue growth, often via ARR or MRR | EBITDA margin or FCF margin | General description, no population |
| BCG, May 2025, on 2023 data | Annual revenue growth | EBITDA margin | 107 private portfolio companies of seven growth equity funds, 93% of them B2B SaaS |
| McKinsey, August 2021 | Revenue growth rate | Free cash flow rate | 100 public US SaaS companies with revenue above $100m, May 2021 |
Read the two consulting rows next to each other. BCG’s study calls a company financially strong if “the sum of its annual revenue growth and EBITDA margin equals or exceeds 40%”. McKinsey’s states that “a SaaS company’s growth rate when added to its free cash flow rate should equal 40 percent or higher”. Both are respectable, both are widely cited, and neither is convertible into the other.
For a software business the gap between those two margins is not a rounding difference. Stock-based compensation is a real expense under GAAP and never leaves the bank account. Customers pay annually up front, so cash arrives ahead of recognised revenue — by up to a year on any single contract, and by roughly half a year on average across a book of them. Both effects push free cash flow far above accounting profit, and both are largest at exactly the companies the rule gets quoted at.
Snowflake’s fiscal 2026 scores −1.5, 3.2, 37.4, 39.6 or 53.1
Snowflake’s fiscal year 2026 ended on 31 January 2026. Revenue was $4,683.9m against $3,626.4m the year before, so revenue growth was 29.2%. That number is the same in every version below. Only the margin changes.
The reported line items, all from the company’s own fourth-quarter results: a GAAP loss from operations of $1,435.2m; depreciation and amortisation of $220.4m and amortisation of deferred commissions of $140.4m in the cash-flow statement; stock-based compensation of $1,599.5m; net cash from operating activities of $1,221.9m against $101.6m of property and equipment purchases, leaving free cash flow of $1,120.3m; and non-GAAP income from operations of $489.7m, which the company presents at a rounded 10% margin.
| Margin definition | How it is built | Margin | Rule of 40 score | Verdict |
|---|---|---|---|---|
| GAAP operating margin | Loss from operations ÷ revenue | −30.6% | −1.5 | Nowhere near |
| EBITDA margin | Loss from operations + $220.4m D&A | −25.9% | 3.2 | Fails badly |
| Adjusted EBITDA margin | The above + $1,599.5m stock comp | +8.2% | 37.4 | Just short |
| Non-GAAP operating margin | $489.7m non-GAAP operating income ÷ revenue | +10.5% | 39.6 | Just short |
| Free cash flow margin | ($1,221.9m − $101.6m) ÷ revenue | +23.9% | 53.1 | Well clear |
One company. One fiscal year. One growth rate. A spread of nearly 55 points between the two ends, four failing versions, and a verdict that runs from “Nowhere near” to “Well clear” without a single underlying fact changing.
The spread is not even stable inside a single label. The EBITDA row above adds back the depreciation and amortisation line only. Add back the $140.4m of deferred-commission amortisation as well — also an amortisation charge, also disclosed in the same statement — and the same EBITDA score rises from 3.2 to 6.2. Three points of movement sit inside one word, before anyone reaches for a different definition on purpose.
The company’s own cash measures do not agree with each other either. Snowflake reports adjusted free cash flow of $1,192.7m alongside the $1,120.3m plain figure, a 25.5% margin against 23.9%, which is a sixth score of 54.6.
None of this is an accusation against Snowflake, which discloses every one of these figures plainly. It is a demonstration of what a Rule of 40 score is worth when it arrives without its definition attached — which is how it usually arrives, in a deck, on one line, next to a logo.
The version only changes the verdict near the line
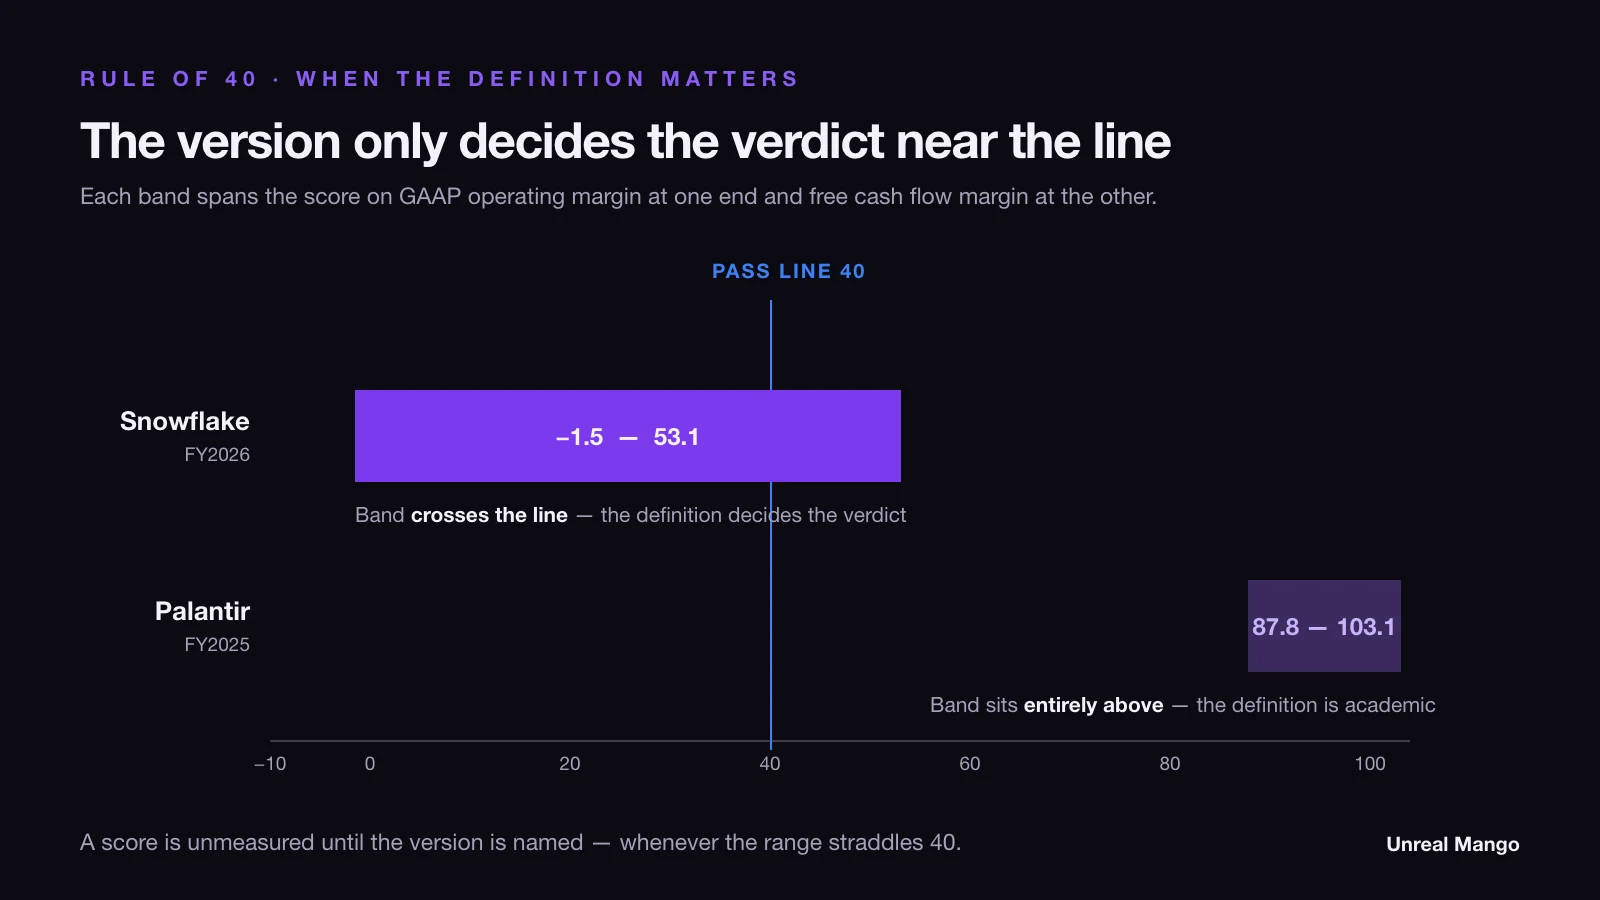
Run the two ends of that range — GAAP operating margin and free cash flow margin — on Palantir’s fiscal 2025, ended 31 December 2025, and the picture changes shape. Revenue grew 56.2% to $4,475m. GAAP operating margin was 31.6%. Free cash flow was $2,100m — $2,133.9m of operating cash flow less $33.9m of capital expenditure — a 46.9% margin.
| Company and year | Growth | Score on GAAP operating margin | Score on FCF margin | Spread | Do the verdicts agree? |
|---|---|---|---|---|---|
| Snowflake FY2026 | 29.2% | −1.5 | 53.1 | 54.6 points | No — fail becomes well clear |
| Palantir FY2025 | 56.2% | 87.8 | 103.1 | 15.3 points | Yes — both clear 40 easily |
Palantir’s two versions still disagree by 15 points. Nobody cares, because both land so far above the threshold that the choice cannot flip the answer.
That gives the practical rule, and it is the one the metric’s popular write-ups leave out: the definition matters only when the company’s range of possible scores touches 40. Palantir’s range runs from 87.8 to 103.1 and never approaches the line, so the argument is academic. Snowflake’s runs from −1.5 to 53.1 and straddles it, so the argument is the whole question. The test is not where the headline score sits — it is whether the other defensible versions land on the same side of 40.
Exit ARR growth and revenue growth part company when growth turns
The margin half of the rule gets all the attention. The growth half quietly does the same thing, and the mechanism is easier to state.
Annual recurring revenue is an exit rate: a snapshot of what the book is worth on the last day of the period. Recognised revenue is an average: the sum of what was actually earned across every day of it. Comparing two exit rates and comparing two averages are different measurements of the same business, and they diverge whenever growth is not steady. The mechanics of what belongs in the ARR figure in the first place are a separate question, covered in our breakdown of annual recurring revenue.
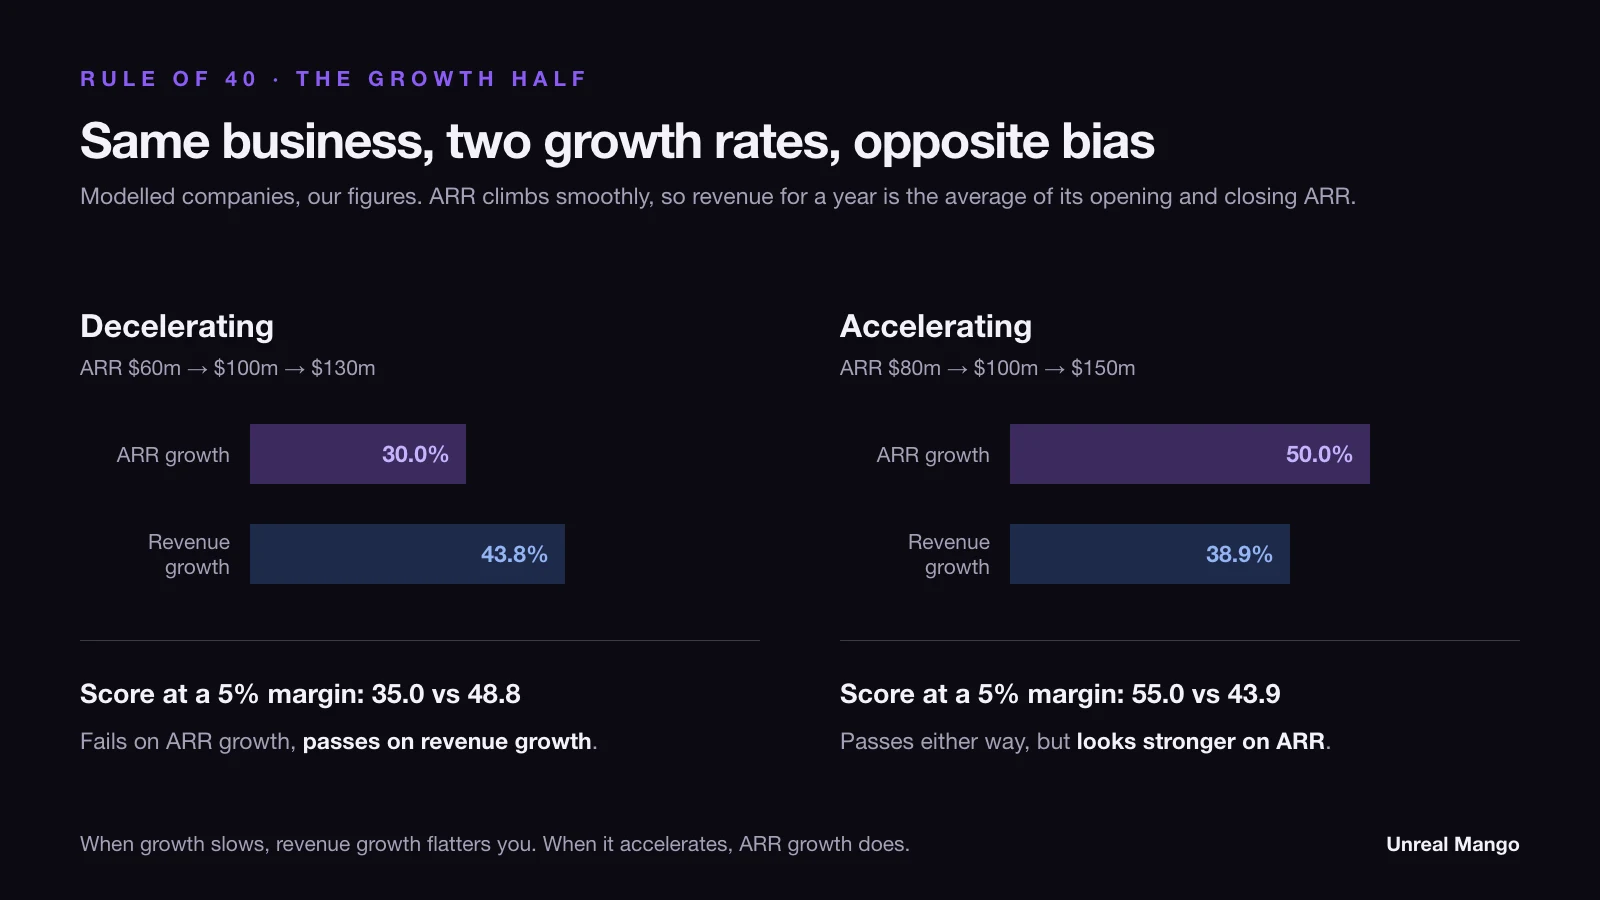
Two modelled companies make the direction visible. Both assume ARR climbs smoothly through each year, so recognised revenue for a year is the average of its opening and closing ARR. These are our figures, not filings.
| Model company | ARR: open Y1 → exit Y1 → exit Y2 | ARR growth, Y2 | Revenue, Y1 → Y2 | Revenue growth, Y2 | Score at a 5% margin |
|---|---|---|---|---|---|
| Decelerating | $60m → $100m → $130m | 30.0% | $80m → $115m | 43.8% | 35.0 on ARR, 48.8 on revenue |
| Accelerating | $80m → $100m → $150m | 50.0% | $90m → $125m | 38.9% | 55.0 on ARR, 43.9 on revenue |
The decelerating company fails on ARR growth and passes on revenue growth, from one set of facts. The accelerating company passes twice, but looks materially stronger on the ARR version.
The bias has a direction worth remembering. When growth is slowing, revenue growth flatters you; when growth is accelerating, ARR growth flatters you. Trailing revenue is still carrying last year’s faster months, so a decelerating company’s revenue line lags its reality by roughly half a year. Most SaaS companies in the current cycle are decelerating, which means the popular revenue-growth version of the rule is, on average, the generous one.
Brad Feld put a $50m floor under his own rule
The most-quoted caveat about the Rule of 40 is that it applies “at scale”. Almost nobody says what scale, and the original post did.
Feld’s 2015 article scoped it to SaaS companies at scale and put a figure on it: assume at least $50 million in revenue. He separately noted that his earlier work on product-market fit “correlates nicely with it once you hit about $1m of MRR” — a much lower bar, about $12m annualised, and offered as a correlation rather than as the same threshold.
Below the $50m line the score stops describing the business. At $8m of ARR, one enterprise contract signed in December instead of January can move revenue growth several points; one senior hire can move margin by more. The rule’s entire tolerance is 40 points, and at small scale ordinary timing noise eats a meaningful share of it. What you are measuring is when things landed, not whether the model works.
BCG’s data lines up with the floor without arguing for it. Across the 107 private portfolio companies in its May 2025 study — 93% of them B2B SaaS, measured on 2023 figures — 26% of those above $80m in revenue exceeded the Rule of 40, against 22% in the $30m to $80m band and just 9% below $30m. Smaller companies do not merely score worse; the score also swings harder for reasons that have nothing to do with quality.
For companies under that floor, the trade the rule is trying to capture is better read through the unit economics directly — how long a customer takes to repay their acquisition cost, which our guide to CAC payback period works through, and how much new revenue each dollar of sales and marketing buys, which is the job of the SaaS magic number.
Who actually clears 40, by size and by cohort
Passing is rarer than the rule’s ubiquity suggests, and the published rates differ because the populations do.
| Study | Population | Share clearing 40 |
|---|---|---|
| BCG, May 2025, 2023 data | Of its 107 private portfolio companies, those above $80m revenue | 26% |
| BCG, May 2025, 2023 data | Same study, revenue $30m–$80m | 22% |
| BCG, May 2025, 2023 data | Same study, revenue below $30m | 9% |
| McKinsey, August 2021 | 200+ software companies observed 2011–2021 | Cleared it 16% of the time |
| McKinsey, August 2021 | Software companies generally | “Barely one-third” |
The 16% figure is the one people misread. It is not a share of companies; it is a share of company-years across a decade, which is a different and harsher statement. It means the typical software company spends most of its life below the line and visits the other side occasionally. In the same dataset, only 1.6% sustained revenue growth above 30% consistently.
The trade the rule encodes is visible in the same work. McKinsey’s top-quartile SaaS companies posted median ARR growth of 45% against 14% for the bottom quartile, with median payback of 16 months against 47, and carried nearly three times the valuation multiple. The durability half of that gap belongs to a different metric, net revenue retention, which asks what last year’s customers pay now rather than what this year’s growth cost.
A minus twenty margin is either a plan or a leak
Wikipedia’s summary offers three profiles as equally valid routes to 40: grow 60% at a −20% margin, grow 20% at a 20% margin, or grow 5% at a 35% margin. Arithmetically they are identical. As descriptions of a company they are not, and the first one is where the rule is most often used to launder a problem.
Losing twenty points of margin is a plan when the spending is buying something that will still be there after it stops: contracted revenue that renews, a category position, a product line that reaches sellable state. It is a leak when the same twenty points buy a growth rate that decays the moment spending is cut — which is what happens when acquisition cost has crept past what a customer’s lifetime is worth, or when the growth is churning through the front door and out the back.
The rule cannot tell those apart, because the two look identical inside it. A single test separates them well enough for a board meeting: hold spend flat for a year in the model and see what the growth rate does. If it degrades gently, the negative margin was an investment. If it collapses, the score was rented.
The same asymmetry applies at the profitable end. Growing 5% with a 35% margin passes the rule, and can equally describe a well-run mature business or one that has stopped investing and is harvesting an installed base on the way down. A Rule of 40 score is a snapshot of a trade, not a direction of travel, and it prices neither of the two futures behind it.
Is the Rule of 40 only for SaaS?
It was built for SaaS and it travels badly. The rule assumes recurring revenue that renews by default, gross margins high enough that growth and margin are genuinely substitutable, and negligible capital expenditure so that free cash flow tracks operating profit. Subscription software satisfies all three.
Businesses that do not are pushed toward the wrong answer. A hardware or services company carrying real capex sees free cash flow diverge from EBITDA structurally rather than temporarily. A business with 40% gross margins cannot convert a growth point into a margin point at anything like the same exchange rate as one with 80% gross margins, so the sum of the two treats unequal things as equal. Usage-based and consumption-priced software sits in between: the revenue recurs, but it recurs at an amount nobody has contracted.
Adjacent recurring-revenue models — subscription media, some marketplaces, managed services with genuine retention — can borrow the rule as a rough sanity check, provided the margin used is the one that reflects their cost structure rather than the one that flatters it.
How to state a Rule of 40 score so it can be checked
A score on its own carries no information, because the reader cannot reconstruct it. Four words fix that, and they cost nothing to add.
State it in this shape: score, growth measure, margin measure, period. “Rule of 40: 43, on revenue growth plus adjusted EBITDA margin, FY2025.” Anyone reading it can now agree, disagree, or recompute. Anyone comparing it with another company’s score can see immediately whether the two are the same measurement.
Three habits follow from that shape.
Pick the version your audience uses, and keep it. A board tracking the trade quarter to quarter wants a version it can influence, usually revenue growth plus adjusted EBITDA or non-GAAP operating margin. An investor pricing an entry wants the version the comparable set is priced on, which for public software leans toward free cash flow. A strategic buyer running a diligence model wants GAAP, because the acquired cost structure is what lands on their income statement. All three are legitimate; only switching between them mid-conversation is not.
Never change version and direction in the same update. A score that improves because the definition changed is the single most common way this metric gets misread, and it is indistinguishable from real improvement unless the previous version is restated alongside. If the definition has to change, publish both numbers for the overlapping period.
Compute the range before you quote the number. Run your own figures through GAAP operating margin at one end and free cash flow margin at the other. If both ends land on the same side of 40, the version you publish barely matters. If the range straddles the line, as Snowflake’s does, the score is not a measurement until the version is named — and anyone quoting it at you without one has not measured anything either.
The rule is worth keeping for what it was built to do: force one number to hold both halves of a trade that companies prefer to discuss separately. It stops being worth anything the moment the number travels without the definition that produced it. If you are working out which version your own reporting should settle on, and what the rest of the metric set around it should be, that is the kind of question we work through with tech and SaaS clients.
10 / Reader questions
Frequently asked questions
01How do you calculate the Rule of 40?
Add the annual growth rate to the profit margin and check whether the total reaches 40. A company growing 25% with a 15% margin scores 40 and passes; growing 25% with a 5% margin scores 30 and does not. The arithmetic is trivial. The work is deciding which growth rate and which margin go into it, because published versions use revenue growth or recurring-revenue growth, and EBITDA, adjusted EBITDA, operating margin or free cash flow margin.
02What is a good Rule of 40 score?
Anything at or above 40 counts as good, and clearing it is rarer than the rule's popularity suggests. BCG's May 2025 study, built on 2023 data from 107 private portfolio companies held by growth equity funds, 93% of them B2B SaaS, found 26% of companies above $80m in revenue exceeded the Rule of 40, 22% in the $30m to $80m band and 9% below $30m. McKinsey put it harder still: barely one-third of software companies achieve it.
03Which margin should you use for the Rule of 40?
Use the one your audience uses, and name it in the same sentence as the score. BCG's benchmark study runs on EBITDA margin, McKinsey's 2021 framing runs on free cash flow margin, and Brad Feld's original post preferred EBITDA while noting he had backtested operating income, net income and free cash flow. All three are defensible. Quoting a score without saying which one is what makes the number unusable.
04Is the Rule of 40 still relevant?
Yes as a sanity check on the trade between growth and profitability, no as a scoreboard you can compare across companies without disclosure. The rule survives because the underlying question is real: buying growth with losses is fine up to a point, and the rule marks the point. What has decayed is its comparability, because the same company can produce a passing or a failing score depending on which published definition is applied.
05What is Palantir's Rule of 40?
For fiscal 2025, ended 31 December 2025, Palantir scores 87.8 on revenue growth plus GAAP operating margin, or 103.1 on revenue growth plus free cash flow margin. Revenue grew 56.2% to $4,475m, GAAP operating margin was 31.6%, and free cash flow was $2,100m on $2,133.9m of operating cash flow less $33.9m of capital expenditure, a 46.9% margin. The two versions differ by 15 points and both clear 40 comfortably, which is why the definitional argument rarely matters at this end of the range.
06Does the Rule of 40 apply to early-stage startups?
Not in the way it applies to larger companies, and the rule's own author said so. Brad Feld's 2015 post scoped it to SaaS companies at scale, suggesting at least $50m in revenue. Below that, one enterprise deal, one hiring round or one annual prepayment can move the margin by more than the whole rule's tolerance, so the score measures timing rather than health. BCG's 2023 data agrees: only 9% of companies under $30m in revenue cleared 40.